| 22 |
The reappearance of malaria |
During the past twenty years malaria has reappeared in greater or less virulence in several places from which I had seen it disappear. As the causes which led to the disappearance of the disease had been observed, it was possible to study the changes which brought about its reappearance; and by appropriate action to make the places healthy again. Probably an experience of true alterations of health and sickness is comparatively rare; in any case they are of interest and value to the sanitation, so I will record them in some detail.
| 22.1 |
Port Swettenham in 1906 |
When, in 1901, the Port was opened, in order to obtain exact information of the number of people who were attacked, I caused, as already mentioned, a daily visit to be made to each Government house. This was continued for several years. When it was discontinued, I caused the Deputy Health Officer to inform me when any officer complained of fever, and no officer received sick leave until he had come to Klang, and his blood had been examined. Further, I issued instructions to the Deputy Health Officer, who was also in charge of the Dispensary, that no person living in Government quarters was to be supplied with quinine except on my orders. I had thus a very firm grasp on the Government population at Port Swettenham. Seeing those who, complaining of sickness, sought sick leave, and making blood examinations if there was any complaint of temperature, I am in a position to state that no officer suffered from malaria from 12th July 1904 until December 1906. In that month, three officers were found to have malaria, which had evidently been contracted in the Port.
The matter was at once reported to the Chairman of the Sanitary Board, the late Mr. J. Scott Mason, afterwards Governor of British North Borneo, and, accompanied by the Executive Engineer, we made a careful survey of the drainage conditions of the Port.
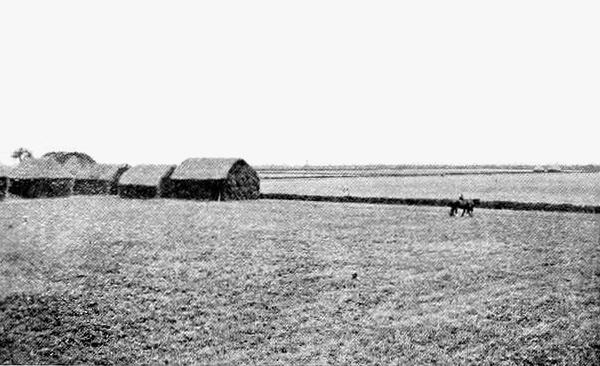
It was, I think, more than a coincidence that, at the very moment of the recrudescence, cement inverts had been put into the road drains at such a level that they effectually blocked all the lateral drains which previously opened into them. The whole of the area marked “C” on the plan (see Figure 4.1) was, therefore, much less efficiently drained than previously; in fact, it was now entirely without any drainage, as Figure 22.1 shows.
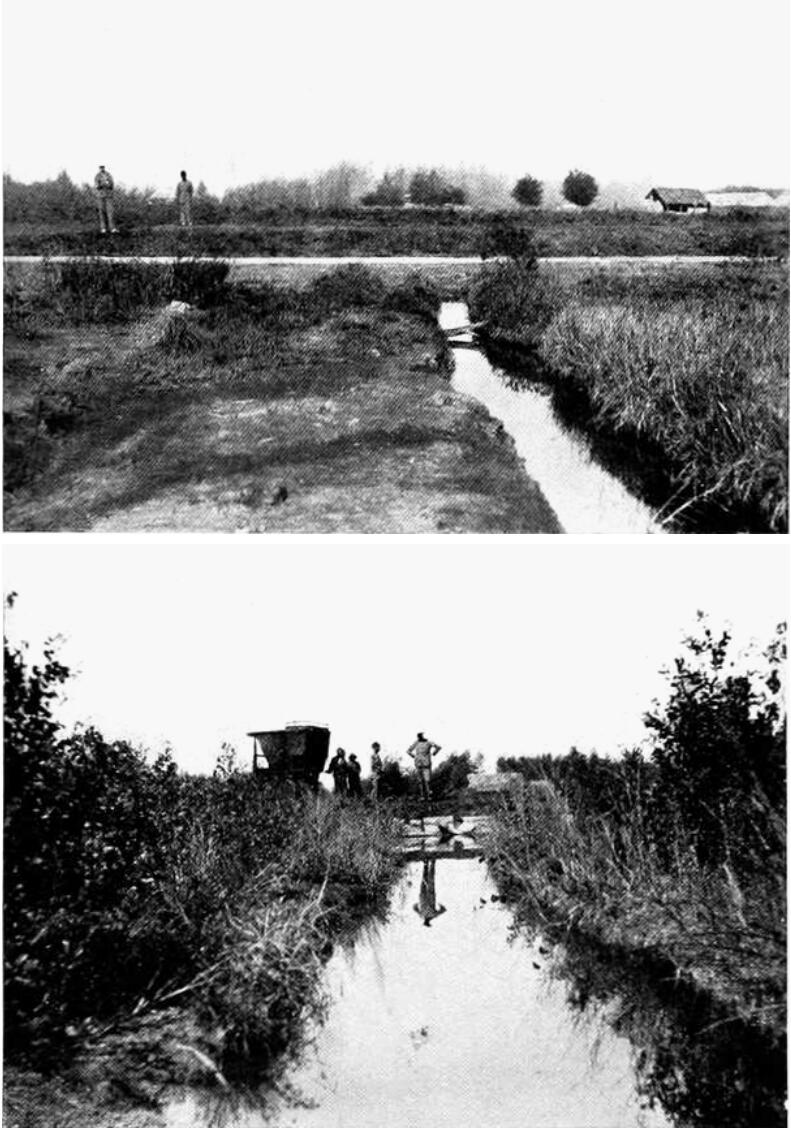
We recognised the fact that a larger population than formerly were living entirely outside the bunded area. In 1904 it numbered 548, whereas in 1901 only 127 lived beyond the bunds, and those were housed along the Klang Road on the edge of a deep drain, and on land that had been fairly well drained before the new concrete inverts had been put in.
| 1904 | 1905 | 1906 | 1907 | 1909 | ||
| Blood examination | No. examined | 87 | 76 | 100 | ||
| No. with parasites | 1 | 0 | 5 | |||
| % with parasites | 1.14 | 0 | 5 | |||
| Spleen examination | No. examined | 100 | 41 | 109 | ||
| No. enlarged | 2 | 9 | 9 | |||
| % enlarged | 2 | 21.9 | 8.9 | |||
Table 22.1 shows that the outbreak affected the spleen rate. In 1906, 1 found evidence in the children of the recrudescence of the disease, simultaneous with its reappearance among the adults, as I shall relate. In 1907, the examinations were made by a dresser. In 1909, I myself made them, and visited, along with the present Medical Officer of Klang, Dr. Millard, every house up to the 4th mile on the Klang Road. Practically every child in the town was seen and was examined by both of us.
We also recognised that the drainage system within the bunds was not so efficient as previously, since in some places filling had sunk, and in other places drains have been diverted and lateral drains obstructed by cementing the mains. The Board decided to spend the balance of a vote in 1907 in cutting outlets for area “C,” but owing to the great competition for labour at the time, it was absolutely impossible to do so. In 1907, I formally brought these matters to the knowledge of Government.
In 1908, when I was in England on leave, the condition was still further aggravated by the extension of the railway embankment from the point marked “K” to the point marked “H,” in order to provide further wharf accommodation. This, of course, completely blocked the outlet of the whole of the drainage from the South bund. I am informed that malaria increased rapidly then, but an outlet was soon made for the water beyond the end of the railway; and as the figures show, the amount of malaria now (1909) in Port Swettenham is not very serious. Government, however, appointed a Commission to make recommendations in 1908; and a sum of $27,000 is being spent on improving the automatic outlet valves, improving and increasing the bunds, and on improving an open sewer system for many of the houses.
I am of the opinion, however, that malaria will not entirely disappear from Port Swettenham until it is recognised that a large proportion is now outside the protected area. The bunded area should be increased to include these.
| 22.2 |
Criticism of the original drainage scheme at Port Swettenham |
Our chief fear in 1901 had been that mosquitoes would breed in the drains within the bunds. We considered it essential the drains should have such a fall that they would dry during every tide, or at least would have such a current as was calculated would prevent the insect from breeding within them. Accordingly, the level of the outlets made in 1901 was that of about half tide. At such a high outfall level, and with a grade to provide a good current, in many places the drains soon ran out practically on to the surface of the soil, especially at the top of the system. Places where water stood when the drains had been completed were, therefore, “filled in” at great expense. Since then, filling has been continued to provide sites for buildings, etc. It must be clearly understood that expense was not allowed to stand in the way of success, as the whole existence of the Port was at stake.
Experience has shown that our fears were groundless; and that the danger from open drains in flat land is nil, if they are kept moderately free from weeds. Any further works will, therefore, be immensely cheaper, since the outlets of the new drains can be put at the level of low water neap tides. Deepening of the drains is more satisfactory than filling, as the cost is a mere fraction; this cannot be too strongly insisted upon.
I am indebted to Government for the figures below and the levels, which show that the general level of Port Swettenham is 2 to 3 feet below that of spring tides. The levels on the plan range from 50.24 to 54.26, and the highest known tide was 56.36. Table 22.2 lists the official levels.
| B.M. above datum | 14.33 |
| High-water spring tide | 55.36 |
| Low-water spring tide | 39.13 |
| High-water ordinary tide | 51.37 |
| Low-water ordinary tide | 42.35 |
| High-water neap tide | 46.65 |
| Low-water neap tide | 45.46 |
| Highest known tide (30/10/09) | 56.36 |
| Invert of culvert 87 | 48.60 |
| Invert of flap valves in South bund | 48.54 |
| 47.59 | |
| 46.67 | |
| Invert of flap valves in North bund | 48.86 |
I make these criticisms in order that others may benefit by the mistakes made in our pioneer work. The level of the outlet is most important; and when a sea is tidal, bunding gives enormous powers of drainage. I need only mention how the English Fens have been drained by bunding, and incidentally malaria has disappeared. I think that is more than a coincidence.
| 22.3 |
Port Swettenham from 1909 to 1920 |
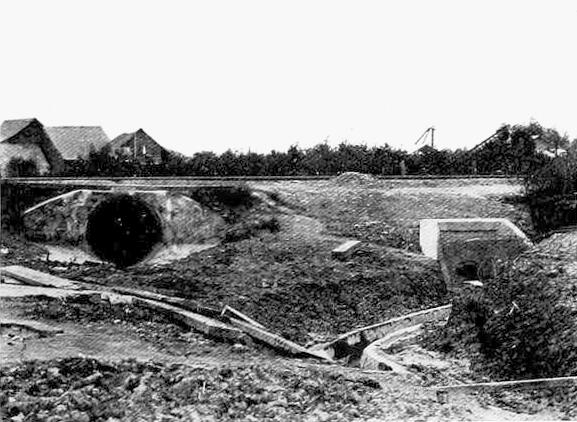
In 1909, I was unable to induce the Government to extend the bunded area to include Area “C,” and so to protect the large population living outside the area originally protected. But Mr. Byrne, the District Engineer of Klang, appreciated my suggestion of lowering the drainage level; and he put a small low-level culvert beside Culvert No. 87, only 3 feet lower (Figure 22.2). This improved the drainage of the land so much that, when a scheme for the whole of the Port came to be discussed in 1914, I insisted on a low-level scheme being put down; and pointed out that the level of the outlets might go still farther down that of the small culvert at No. 87. This was done in the new scheme, to be presently described.
In 1911 the decision to build a quarantine station at Port Swettenham for coolies arriving from India, once more made the malaria a question of importance and urgency. To pour thousands of coolies into a quarantine station where they would contract malaria would have been a disastrous course to pursue; and I advised the Planters’ Association of Malaya to insist on the Port being made healthy as a condition of a quarantine station being built there. This they did; and the work was begun. The area required for the building was bunded and drained (it being below high-tide level, this was necessary before even a start could be made with the buildings); but on Area “C,” which was adjacent to the station, the work was not completed for several years after the scheme was sanctioned. The bund was built and a gate of sorts erected; but the tide entered almost unimpeded; no drainage system existed; and the last condition, which was worse than the first, lasted until 1917.
| 22.4 |
Extension of the drainage |
In 1914 a plan for the drainage of the new area, excluding that actually occupied by the quarantine station, was prepared. But it included many of the mistakes which one would expect from an engineer who was not familiar with the previous history of the drainage of the Port. Over $100,000 was to be spent on masonry or glazed earthenware drains, most of which would have been quite unnecessary. But the chief fault lay in the omission to consider the level of the outlets of the drains through the bunds. The total estimate was $149,342.
The plan was rejected; and a small committee appointed to prepare another. I pointed out the history of the drainage of the Port, the advantages of a low-level drainage system; and insisted that masonry drains should only be laid down where sewage had to be carried in addition to the ground water; where the latter only was present, open earth drains had proved to be sufficient on estates in similar land. On these lines a new plan was prepared, the estimate for which was $68,849, a saving of over $60,000 on the first scheme. From a malarial point of view the new plan was infinitely superior; another illustration of the connection between knowledge, efficiency, and economy. In view of the importance of the matter I give a summary of the two estimates, so that they may be compared and the lesson more clearly brought out (see Table 22.3).
| Estimate of first scheme | |
| Earth drains | $2,677 |
| Masonry drains, 9-inch | $22,936 |
| Masonry drains, 12-inch | $75,636 |
| Earth drains with glazed inverts | $8,657 |
| Culverts | 16,860 |
| Screw-down gates, 9 | $9,000 |
| $135,766 | |
| Contingencies, 10% | $13,576 |
| Total | $149,342 |
| Estimate of second scheme | |
| Earthwork in drains | $13,200 |
| Masonry work in drains and culverts | $14,000 |
| Subsoil drains | $3,300 |
| New bund at outlet “C” | $360 |
| Filling low ground, say | $3,000 |
| Strengthening bund | $2,500 |
| New sluices, including railway culvert at “B” | $26,230 |
| $62,590 | |
| Contingencies, 10% | $6,259 |
| Total | $68,849 |
This estimate and plan were approved, and the work will be completed in the course of 1920. Already it is shown how advantageous deep-level drainage is; all the portions already drained have a great depth of dry soil.
The Engineer-in-charge, Mr. F. D. Evans, has supplied me with the following data of the levels:
- Mean sea-level is given as 100.
- Maximum spring tides range between about level 92 and level 108.
- Minimum neap tides range between about level 98.6 and 101.3.
- The highest tide on record is about 109.5.
The sill of outlet “A” (cf. Figure 4.1) is set lower than the level 95, as an experiment; but the drains were not set down to it. Outlet “E” with its drains is set lower than 96. The outlets in creeks are set higher. The engineer is satisfied with the lowest outlet; and adds that all the drains could be down to 95, or 5 feet below mean sea-level.
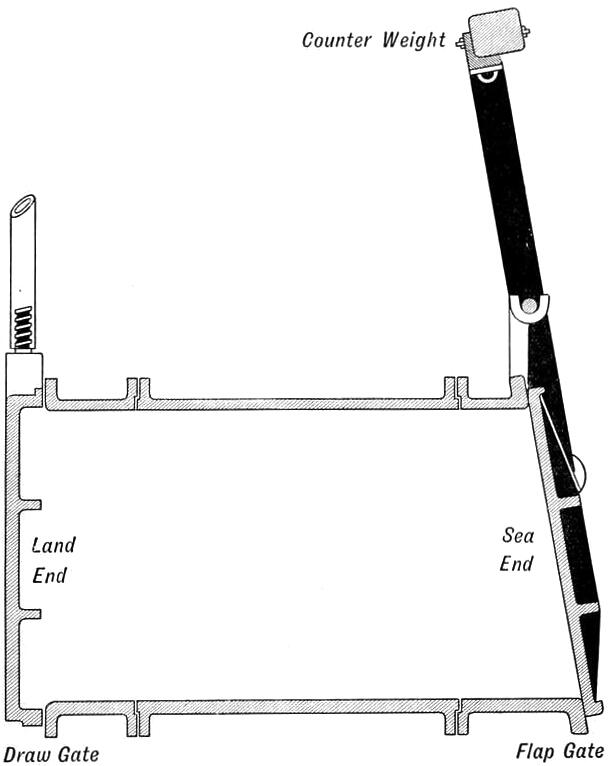
Only on one or two days in the month are the gates kept closed on account of the neap tides; this has not proved a serious disadvantage, as the gates, which in addition to automatic flaps have screw-down valves, keep the water out effectively. The great depth and capacity of the drains, as well as the large capacity of the well-drained soil to absorb rain, prevent flooding of the land when heavy rain falls during the period when the gates are shut.
The population of Port Swettenham in 1920 was found from the Rice Controller’s forms to be approximately 6000.
The spleen rate of the Malay school children was 7%; but the true rate was nil. At the examination in 1920 there were forty-two children present. Of these, three had enlarged spleens; two were brothers who had come two years before from Port Dickson, and one, a policeman’s child, had come from Rawang. All three gave a history of fever before coming to Port Swettenham.
| 22.5 |
The reappearance of malaria on an estate within tidal influence |
A few miles from Port Swettenham, there is an Estate “CC” situated on a tidal river, the water of which is practically pure sea water. Most of the estate is above the reach of high tides, but portions are within tidal influence; and so the estate at these portions is enclosed within embankments. The drainage was good; the land well cultivated; and there was a large healthy labour force as free from malaria as any flat-land estate in the district. The death rates were low—9, 5, and 9‰ in 1905, 1909, and 1910 respectively; and the spleen rate only 3% in eighty-two children in 1909; the daily number in hospital out of a labour force of several hundreds, usually between two and four; and the trivial illnesses treated on the estate hardly more.
There were a few more cases of malaria than usual towards the end of 1910; but suddenly in September 1911 malaria became virulent. The death rate jumped from 9 in 1910 to 101 in 1911; the spleen rate rose from 3 in 1909 to 58 in 1911. The hospital could not contain the sick; and in November there was an average of eighty sick on the estate in addition to over thirty daily in the hospital.
The outbreak caused great loss to the estate. Some $5000 were spent on the hospital in new buildings, but that was the least of the loss. The Indian labour force rapidly melted away from about 600 to 300 coolies; the rubber crop could not be collected, and was short of the estimate by 30,000 lb., which at the then price of rubber probably represented a loss of some £6000 sterling.
| 22.5.1 |
The Cause of the Outbreak |
The year 1911 was more than usually malarious, and a breakdown in the quarantine arrangements at Penang had a serious effect on the mortality of the year. But the estate had recruited only eighty-four new coolies, and something more than an annual variation seemed necessary to account for the outbreak, which showed itself not merely in attacks on the adults, but also in its effects on the children, many of whom died suddenly.
For a time I was completely at a loss to account for the epidemic. In ten years I had never seen the reappearance of malaria on a flat land estate; none of the lines, as far as I knew, and I thought I knew the estate thoroughly, were within 40 chains of jungle or swamp; and the manager assured me this was so. I was, therefore, seriously alarmed at the outbreak; it looked as if we could not rely on healthy flat land estates remaining healthy; that malaria, on the flat land estates, might become persistent, as in hill land, from the appearance of some malaria-carrying Anopheles hitherto not recognised. For the whole rubber industry, indeed for the whole country, the outbreak looked most ominous.
Accordingly, I searched every drain, pool, and puddle close to the coolie lines, and among the rubber trees for some new Anopheles; but without discovering any. In the course of my examination, I decided to tour the whole estate, and then I discovered the cause of the outbreak was a very simple one.
Requiring increased line accommodation for his labour force, in May 1910 the manager built new lines about 20 chains from the jungle, without realising that the jungle was so near, for at two points the boundary of the estate bends inwards, instead of running in a straight line as I had assumed it did. The new sites were responsible for the cases of malaria in 1910, which had quickly disappeared; and it was not until September 1911 that the disease became of serious consequence—that is some fourteen months after the lines had been built.
The outbreak would have been confined to the new lines, but, for estate reasons, the labour force had been redistributed; many of the infected coolies had been moved back to the old lines, and the healthy coolies moved to the new lines. In consequence of these changes, when I came to investigate the outbreak, I found malaria cases in the old lines, and the disease appeared to be spread over the whole estate. It was only after I discovered that the new lines were close to the jungle, and made inquiry about any changes in the distribution of the labour force, that the whole story was elucidated.
| 22.5.2 |
The remedy |
The remedy was obvious. The new lines were at once abandoned; others were built on the old site, and the health at once improved, as the figures in Table 22.4 show.
| Year | Labour force | Death reate |
| 1907 | 430 | 30 |
| 1908 | 432 | 9 |
| 1909 | 394 | 5 |
| 1910 | 516 | 9 |
| 1911 | 445 | 101 |
| 1912 | 354 | 19 |
| 1913 | 461 | 15 |
| 1914 | 450 | 20 |
| 1915 | 357 | 11 |
| 1916 | 325 | 27 |
| 1917 | 356 | 8 |
| Date | No. of children examined | Spleen rates (%) |
| 1909 (Dec.) | 82 | 3 |
| 1911 (Oct.) | 86 | 58 |
| 1913 (Jan.) | 73 | 19 |
| 1914 (Mar.) | 112 | 4 |
| 1918 (Mar.) | 104 | 0.9 |
In 1918 the only child with enlarged spleen came from a malarious estate in Johore. The morale is plain. An Estate Medical Officer should know by inspection the whole of an estate, and should, if possible, possess a plan of it.
| 22.6 |
The story of a coast railway |
In Chapter 5, I told the story of a coast road: how the road blocked the drainage of land inland to it; how it appeared to be responsible for a great wave of malaria; and how, as drainage was improved, the malaria gradually disappeared over a wide extent of country. Many years later, history was to repeat itself in the same area; this time the offender was a railway running parallel to the coast. Fortunately, the outbreak was less severe on the whole, although intense enough in places, as I shall show. It is of interest, too, that the outbreak did not occur until some considerable time after the construction had been completed; it was not due to the construction coolies and camps to which Major Christophers and Dr. Bentley have so clearly traced many outbreaks in India. The railway, like the road, runs from Klang to Kuala Selangor, a distance of some 28 miles; for the first 12 miles it is on the sea side of the road, but at that point it crosses the road and runs along rubber estates and through native holdings. From the 12th to the 15th mile, it is within a mile or so of the sea; and the land in this section, being close to the Mangrove Zone, is at a rather lower level than along most of the track. It was here the malaria first showed itself. The railway was opened to traffic in 1914.
| 22.6.1 |
Malaria reappears on “PG” Estate |
For a year or so after it was opened in 1906, this estate suffered from malaria; but by 1907 it was healthy, and remained so until 1915, as the death rates show. In January 1913, the spleen rate of 120 children was 4%.
The health continued satisfactory until September 1915; towards the end of that month, and until the end of the year, malaria was present to a considerable extent. In view of the complete freedom from malaria in the past, it seemed at the time impossible to believe the whole of the ill-health was due to malaria; especially as only 3 out of 120 children had enlarged spleen. Accordingly, 150 coolies, who were anaemic, were given a course of chenopodium treatment in order to eliminate ankylostomiasis as a contributing factor in the ill-health (about 99% of Indian labourers harbour the worm).
Health improved somewhat in the early months of 1916, these being the least malarious months in the year; but, by July, there was no doubt we had to face the fact that, for some reason or other, malaria had taken a firm hold on the estate. Not only had the acting manager suffered from the disease, but so had his servants. Of seventy-two coolies who had arrived from India between 1st November 1915 and 31st July 1916, sixteen had absconded; and of the remaining fifty-four, no fewer than thirty-nine, or 72%, had suffered from malaria since their arrival on the estate. Finally, the spleen rate had jumped from 3/120 (2.5%) in September 1915 to 35/144 (24.3%) in July 1916.
| 22.6.2 |
The cause of the outbreak |
The outbreak was difficult to explain. The lines remained on the sites they had occupied for years; the drainage of the estate had been improved year by year. It was therefore necessary to look outside the estate boundary for the cause; some condition that had come into force within the previous two or three years; something that had presumably created mosquito breeding places, which had not previously existed.
Having this in mind, it occurred to me that, although the railway had not interfered with the estate drainage, it might have done so with that of the native holdings; and, in any case, had probably created a series of borrow pits which would be breeding places for Anopheles. An examination showed this to be the case.
In borrow pits along the railway, the following species of Anopheles were found: A. rossi, A. sinensis, A. umbrosus, and in enormous numbers A. ludlowi. A. umbrosus was a known carrier. Dr. Barbour, who kindly dissected some A. ludlowi, found in the first he examined the salivary glands “stuffed with sporozoites” (13/8/16).
An interview with the Acting General Manager of Railways found him willing to drain the borrow pits; a cable from the directors of the estate gave the manager a free hand to carry out my recommendations. The borrow pits and native holdings had their drains opened up; oil was freely used and health rapidly improved. Today the health is excellent again (see Table 22.5).
| Year | Labour force | Death reate (‰) |
| 1907 | 200 | 10 |
| 1908 | 278 | 14 |
| 1909 | 224 | 8 |
| 1910 | 301 | 9 |
| 1911a | 430 | 30 |
| 1912 | 502 | 3 |
| 1913 | 472 | 10 |
| 1914 | 542 | 12 |
| 1915 | 605 | 36 |
| 1916 | 472 | 42 |
| 1917 | 462 | 30 |
| 1918b | 453 | 57 |
| 1919 | 452 | 13 |
| Year | No. examined | Spleen rates |
| 1913 (Jan.) | 120 | 4 |
| 1915 (Sep.) | 120 | 2 |
| 1916 (Jul.) | 144 | 24 |
| 1917 (Sep.) | 130 | 28 |
| 1918 (Mar.) | 95 | 13 |
| 1919 (Nov.) | 132 | 8 |
- a
- Quarantine
- b
- Influenza
In 1919, at the examination, ten of the eleven children with enlarged spleen had been several years on the estate; so it is evident the enlarged spleens are evidence of the outbreak of 1916. In a letter dated November 1919, the manager tells me, “at the present time, conditions of health could not very well be better.”
| 22.6.3 |
Estate A |
The adjoining estate suffered in a similar way; and so did others to a lesser degree. The cure was similar. It is unnecessary to give these in details.
The wave of malaria spread inland to a considerable distance and affected estates which one expected might have escaped. A number of conditions exist in this district, which call for careful investigation in the light of our present knowledge of malaria; for this outbreak shows the margin of safety of some of these estates is small.
| 22.6.4 |
The Romans in the fens of Lincolnshire |
Before closing this section I would appeal to the engineers of this and other countries, not to allow history to keep on repeating itself. Some time ago I was reading a book about the Fens of Lincolnshire in England, and therein noted some things not without bearing on this matter:
“The Romans, discovering the remarkable fertility of certain of the dry or drying parts, desired to increase their area, and formed a rude plan for the reclamation by embanking. … They laid down, too, certain causeways across the Fens, a notable example of which extends from Denver in Norfolk, over the Wash to Chark, and from thence to Marsh and Peterborough, a distance of about 30 miles. The Roman embankments, however, along the coast seem to have had the result of increasing the inundation of the low-lying lands of the Level.”
Then came some lines, as a quotation, the source of which is not given: “whilst they dammed the salt water out, they also held back the fresh, no provision having been made for improving and deepening the outfalls of the rivers flowing through the Level into the Wash. The Fenlands in winter were thus not only flooded by the rainfall of the Fens themselves, and by the upland waters which flowed from the interior, and also by the daily flux of the tides which drove in from the German Ocean, holding back the fresh waters, and even mixing with them far inland.”
So there is precedent for coast roads, if not for coast railways, interfering with drainage; but surely work which “leaves a trail of malaria behind is bad engineering.” It is high time to break with the past.
| 22.7 |
Malaria from the delayed spread of A. maculatus—Klang Town |
The town of Klang is situated at the end of a small range of low hills isolated from other hills belonging to the group of Coastal Hills. The malaria from which it suffered originally was carried by A. umbrosus; and simple open drainage eliminated the mosquito and its malaria. Being isolated from the other hills, which from 1901 to 1907 were still under jungle, the town for long escaped invasion by A. maculatus. But with the great opening of land from 1907, due to the growth of the rubber industry, the adjacent hill land was gradually cleared of its jungle; A. maculatus became widespread in the hills; and in 1913 this mosquito was found in small quantity in some of the hill-foot drains in Klang town. Occasional cases of malaria occurred; but the disease never gained a serious hold on the town; for soon after the discovery of the insect, the open hill-foot drains in which it had been found were converted into subsoil drains.
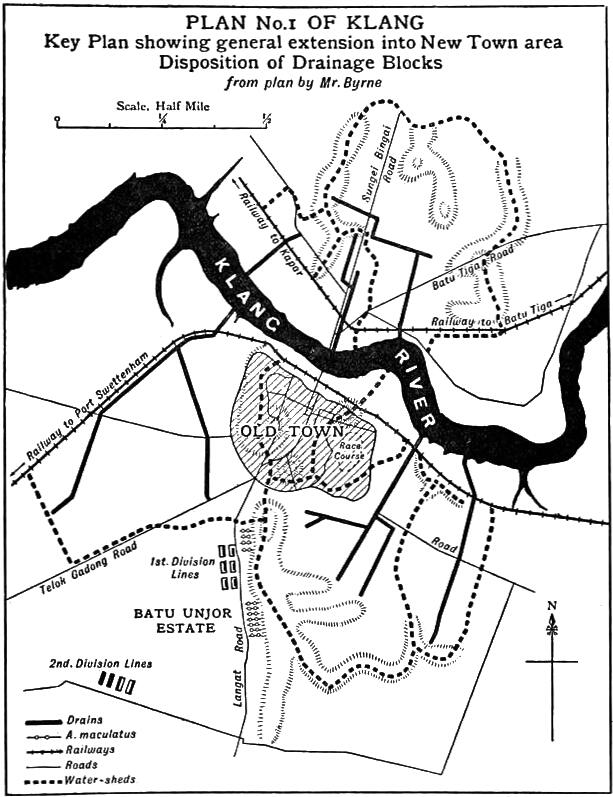
The town had increased in size; today (1920) the population is over 20,000. To protect them, a scheme for improving the drainage of what may be called the “suburbs” was prepared by Mr. Harold E. Byrne in 1916, at an estimated cost of $78,400. It drains an area of 1868 acres. The scheme was approved, and has since been carried out except for some of the sluice gates.
Although occasional cases of malaria occur in Klang, particularly from the less well-drained land between the railway and the river, the total amount is small, as the spleen rates observed in the Anglo-Chinese school show (Table 22.6).
| Date | No. examined | No. enlarged | Observer |
| 1915 (Dec.) | 125 | 1 | Chief dresser, government hospital |
| 1916 (Dec.) | 151 | 1 | " |
| 1917 (Dec.) | 172 | 2 | " |
| 1918 (Dec.) | 163 | 1 | " |
| 1919 (Dec.) | 198 | 1 | " |
| 1920 (Jun.) | 135 | 2 | M. Watson |
This school has pupils of all nationalities, Chinese, Tamils, Malays, etc., and is representative of the general population. On 8/6/20 I examined the children only under fourteen years of age. Of the two with enlarged spleen, one had arrived only three months before from an estate where he had suffered from fever; the other was eighteen months from India where he had fever.
| Name of school | Date | No. examined | No. enlarged |
| Bukit Rajah School | 1917 (Dec.) | 75 | 3 |
| " | 1920 (Mar.) | 93 | 3 |
| Klang School | 1920 (Mar.) | 130 | 5 |
Similar observations were made in Malay schools (Table 22.7). Of the five children with the enlarged spleen in Klang Malay School in 1920, only one lived within town limits. All these figures show that Klang still retains a fairly complete immunity from malaria.
| 22.7.1 |
Batu Unjor Estate |
About a mile from Klang on the Langat Road is what is now called Batu Unjor Estate; and on the opposite side of the road, Tremelbye Estate and some native holdings. At the time this part of Tremelbye was under jungle, it was full of A. umbrosus, as I recorded in Section 2.5; and the bungalow of Batu Unjor Estate was malarious.
With the opening of Tremelbye Estate in 1906, A. umbrosus and the malaria disappeared; and Batu Unjor became a healthy estate, described as Estate “X” in the earlier part of this volume.
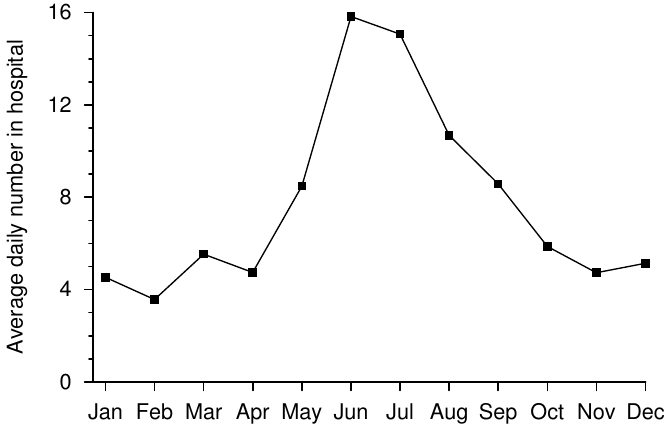
It continued healthy until 1913, when a ravine in a native holding opposite the lines of Division I. was invaded by A. maculatus. The native owner at first refused to permit the estate to control the mosquitoes, and a sharp outbreak of malaria occurred, showing the maculatus rise in the month of May (Table 22.8).
| Month | Admissions | |
| 1913 | 1918 | |
| January | 10 | 1 |
| February | 2 | 2 |
| March | 18 | 1 |
| April | 22 | 17 |
| May | 60 | 18 |
| June | 36 | 25 |
| July | 9 | 13 |
| August | 20 | 12 |
| September | 30 | 15 |
| October | 26 | 4 |
| November | 40 | 1 |
| December | 21 | 0 |
Dr. Ansley-Young gives me the spleen rates taken quarterly since 1915. The contrast between Division I. which is close to the hill, and Division II. which is out on the flat land, is striking. Dr. Ansley-Young attributes the rise of malaria in 1918 to some breeding places having been overlooked by the oilers; in fact he found A. maculatus breeding close to the lines.
| Year | Quarter ending | Division I | Division II | ||
| Examined | Enlarged (%) | Examined | Enlarged (%) | ||
| 1915 | 30th September | 15 | 26.6 | 23 | 8.7 |
| 31st December | 10 | 30.0 | 19 | 0 | |
| 1916 | 31st March | 38 | 10.5 | 25 | 0 |
| 30th June | 30 | 16.6 | 24 | 0 | |
| 30th September | 43 | 2.3 | 27 | 0 | |
| 31st December | 39 | 7.7 | 31 | 0 | |
| 1917 | 31st March | 37 | 0 | 29 | 0 |
| 30th June | 40 | 0 | 25 | 0 | |
| 30th September | 48 | 2.1 | 28 | 0 | |
| 31st December | 37 | 0 | 36 | 0 | |
| 1918 | 31st March | 38 | 7.9 | 32 | 0 |
| 30th June | 32 | 31.2 | 29 | 0 | |
| 30th September | 44 | 11.3 | 32 | 0 | |
| 31st December | 42 | 19.0 | 23 | 0 | |
| 1919 | 31st March | 62 | 14.5 | 41 | 0 |
| 30th June | 54 | 9.2 | 27 | 0 | |
| 1920 | 30th June | 66 | 10.6 | 55 | 0 |
| 22.7.2 |
Estate “S” |
Haron and Klang Lands Estates are, like Klang town and Estate “X,” situated on a small range of hills. They lie about 3 miles from the Klang range, and parallel to it. Most of the range was, until comparatively recently, covered by jungle, and the malaria was caused by A. umbrosus, which was abundantly found in the jungle, coolie lines, and bungalows.
In 1912, on my recommendation, close on 200 acres of jungle were opened up, in two places—which pushed the jungle, if not 40 chains from the lines, at least much farther than it had been.
In view of the extension of A. maculatus to Klang and Estate “X” in 1913, I was anxious lest a similar event should occur on the hill division of this estate. Klang Lands Division is flat land, and the spleen rate at once fell; the hill division, Haron, contains only one ravine, which I searched time and again for A. maculatus without success. Tables 22.10 and 22.11 show the death rates and spleen rates.
| Year | Labour force | Death rate |
| 1908 | 262 | 116 |
| 1909 | 373 | 16 |
| 1910 | 573 | 54 |
| 1911 | 768 | 97 |
| 1912 | 1061 | 10 |
| 1913 | 1065 | 26 |
| 1914 | 499 | 30 |
| 1915 | 351 | 14 |
| 1916 | 432 | 16 |
| 1917 | 506 | 26 |
| 1918 | 499 | 47 |
| 1919 | 477 | 20 |
| Year | Haron | Klang Lands | ||
| No. examined | Spleen rates | No. examined | Spleen rates | |
| 1909 | 32 | 31 | 20 | 20 |
| 1913 | 84 | 15 | 51 | 7 |
| 1915 | 27 | 22 | 25 | 4 |
| 1916 | 53 | 16 | 33 | 3 |
| 1917 | 70 | 14 | 37 | 0 |
| 1920 | 36 | 36 | 46 | 4 |
The position, therefore, was that, while the health as a whole had greatly improved, and the flat land division had become practically free from malaria, on the hill division the spleen rate refused to fall satisfactorily, and malaria still persisted. It is true jungle swamp existed within 40 chains of the lines, but I was not completely satisfied that it was responsible for all the malaria.
In 1919 I was on leave; and on my return found there had been an outbreak of malaria in the middle months of the year on the hill division with the characteristic curve of A. maculatus malaria. No larvae were, however, found in the ravine in February and March of 1920. But an examination of the children showed the spleen rate was higher than it had ever been: the rate for fourteen children in the lines nearest to the ravine was no less than 57%; against 22% for seventeen children in lines farther off.
I felt pretty certain after this that A. maculatus had been in the ravine in 1919, and would probably return in 1920, on the cessation of the wet weather. Since the cost of oiling would be considerable, it appeared to me more satisfactory to prove definitely the existence of the mosquito before recommending oiling. Towards the end of May malaria began to increase, and A. maculatus was found in the ravine in great abundance. Oiling was begun at once, and I have little doubt will give excellent results; for the manager, Mr. Hammond Smith, has had experience of, and success with, oiling on Pitchakawa, an estate situated at the other end of this same small range.
Some years ago I found A. maculatus in the ravines of Pitchakawa, and oiling was begun. The spleen rates show the results (Table 22.12).
| Year | No. examined | Enlarged spleens | Spleen rates (%) |
| 1914 | 41 | 18 | 43 |
| 1916 | 46 | 26 | 56 |
| 1917 | 28 | 13 | 46 |
| 1920 | 45 | 6 | 13 |
In 1920 all the six children with enlarged spleen had been over five years on the estate, except one who had been three years.
Of twenty-seven children that had been transferred from Klang Lands Divisions about eight months ago, not one had an enlarged spleen. All the children looked well and healthy. Excellent work had been done here.
| 22.8 |
The reappearance of malaria on a hilly estate |
The estate, which comprises both hill and flat land, has its coolie lines at the foot of the hills, because there is not sufficient flat land to allow the lines to be built half a mile away from the hills.
As a consequence of the presence of A. maculatus, the estate was intensely malarious. Between 1907 and 1910, no fewer than eight Europeans resigned on account of ill-health; one of them died. The coolies suffered equally. In 1912, a subsoil drainage scheme was carried out very thoroughly by one of the staff of the estate, and, although the pipes in places were laid on a steep hillside, they were not disturbed by heavy rain. In my notes of 1912 I find: “The fact that I saw it after four days in which 5.01 inches of rain had fallen, with one shower of 2.44 inches in forty-five minutes, shows how thoroughly the work has been done. Not only had the whole system withstood the heavy rainfall without suffering the least damage, but all the finished portion was completely dry within twenty-four hours of the rain ceasing.”
The result of this excellent work was soon seen in the improved health of the children and labourers (Table 22.13). The births increased from two in 1911 (both children died) to nineteen in 1914; and the European health also improved.
| Year | Children examined | Spleen rate (%) | Labour force | Death rate |
| 1911 | – | – | 373 | 160 |
| 1912 | – | 50.0 | 492 | 68 |
| 1913 | 91 | 42.8 | 501 | 24 |
| 1914 | 111 | 29.7 | 520 | 13 |
| 1915 | 131 | 10.6 | 500 | 10 |
In 1918, I was asked to visit the estate again, as the health had become bad. The two Europeans on the estate were constantly down with fever, and another was on leave on account of it. The spleen rate showed an increase (Table 22.14).
| Location of residence on estate | Year | No. examined | Spleen rate (%) |
| Old site, near the hills | 1915 | 135 | 10.6 |
| 1918 | 100 | 43.8 | |
| New site, farther from the hills | 1918 | 18 | 16.0 |
| 22.8.1 |
Deaths |
There had been twenty-nine deaths for the first eight months of 1918, giving a death rate per annum for working coolies of 64.9‰ against 10‰ in 1915. In addition, nineteen children had died. The admission rate to hospital had increased, and additional hospital accommodation had been erected at considerable cost.
| 22.8.2 |
The cause of the recrudescence |
On revisiting the main ravine next the lines, which used to be the chief source of A. maculatus, it was evident that the importance of maintaining the anti-malaria work had not been fully realised. A considerable amount of water was still coming from the pipes, which had thus stood the test of six years’ use without taking much harm. But probably half of the water from the ravine was coming down an open channel scoured out by the storm water. In some places, there were probably pipes blocked by silt, but on the whole, from the amount of water discharging from the pipes, it would appear that blocking is comparatively slight.
Oiling was being done with a not very effective hand sprayer; and on my visit, I found the oiling coolie fast asleep in the upper part of the ravine. The war had thrown special work and responsibility on the manager; and, through shortness of staff, insufficient attention had been given to the anti-malaria work.
| 22.8.3 |
The result |
On my pointing out these things, the drainage and oiling were again made efficient, and the health rapidly improved. Writing in June 1920, the Estate Medical Officer says, “the work on the main ravines is all in good order … leads and road drains are now being made thoroughly and systematically oiled.” He reports the spleen rates as shown in Table 22.15. From these figures it is evident that the health has become practically normal again.
| Year | Children examined | Spleen rate (%) |
| 1919 | 133 | 9.0 |
| 1920 | 171 | 3.5 |
Another example of the reappearance of malaria on a hill estate is given in Section 18.5. Here, the malaria came from the ravines of a newly opened estate which adjoined estate “SC.”