| 3 |
Glycolysis |
| 3.1 |
Overview of glucose metabolism |
| Pathway | Function |
| glycolysis, citric acid cycle, respiratory chain | complete degradation of glucose for ATP production |
| hexose monophosphate shunt | degradation of glucose for regeneration of NADPH |
| glycogen synthesis and degradation | short-term glucose storage |
| gluconeogenesis | synthesis of glucose from amino acids, lactate, or acetone |
Glucose is a key metabolite in human metabolism, and we will spend a good bit of time on the various pathways that are concerned with the utilization, storage, and regeneration of glucose. The first step in the degradation of glucose is glycolysis, which breaks down glucose to pyruvate. The main purpose of glycolysis is the generation of energy (ATP). A modest amount of ATP is produced in glycolysis directly, but much more ATP is formed downstream of glycolysis through the complete oxidation of pyruvate.
An alternative pathway for complete glucose breakdown is the hexose monophosphate shunt, which produces NADPH rather than ATP. Both ATP and NADPH are needed in every cell, and accordingly both glycolysis and the hexose monophosphate shunt are ubiquitous.
Glycogen is a polymeric storage form of glucose, not unlike starch, which is found in plants. Glycogen is most abundant in the liver and in striated muscle,11 although some is found in other tissues also. Glycogen is synthesized when glucose supply is high, and its degradation helps to maintain the blood glucose level when we are fasting. When glycogen is depleted, more glucose is synthesized from scratch in gluconeogenesis. This pathway’s most important substrates are amino acids, which are obtained either from a protein-rich diet—for example, when we feast on meat exclusively—or, during starvation, from breakdown of cellular protein, mainly in skeletal muscle. Gluconeogenesis occurs in the liver and in the kidneys.
| 3.1.1 |
The place of glycolysis in glucose degradation |
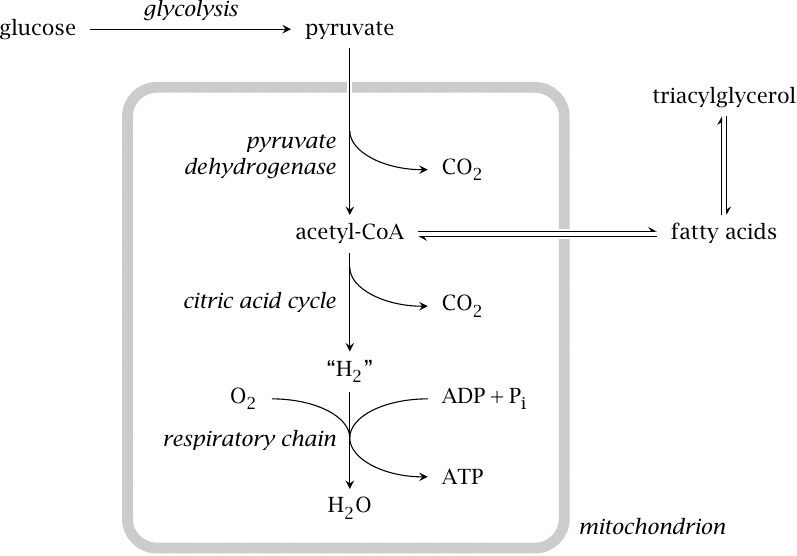
As noted above, glycolysis is only the first stage of glucose degradation. Under aerobic conditions, most of the pyruvate formed in glycolysis undergoes complete oxidative degradation to CO2 and H2O.
Pyruvate destined for complete degradation is transported to the mitochondria, where it is decarboxylated to acetyl-CoA by pyruvate dehydrogenase. Acetyl-CoA is completely degraded in the citric acid cycle (or tricarboxylic acid cycle; TCA cycle for short). The “H2” that is produced here is not gaseous but bound to cosubstrates, as NADH + H+ and FADH2, respectively. It is subsequently oxidized in the respiratory chain; it is in this final stage of glucose breakdown that most of the ATP is actually produced.
If glucose is available in excess of immediate needs and glycogen is already stocked up to capacity, it will still be broken down by glycolysis and pyruvate dehydrogenase to acetyl-CoA. However, acetyl-CoA will then not be oxidized, but it will instead be used for fatty acid synthesis; the fatty acids are converted to triacylglycerol. Fatty acid synthesis occurs in the cytosol of cells in the liver and fat tissue.
We will now consider all these pathways in their turn, starting in this chapter with glycolysis.
| 3.1.2 |
Alternate structures of d-glucose |
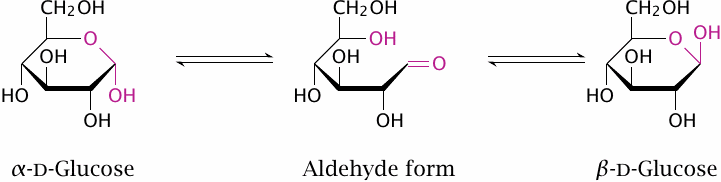
Glucose occurs in α and β ring forms that are anomeric at the C1 carbon (highlighted). In the presence of water, one form can reversibly change into the other via an open-chain aldehyde form. Polymers of glucose contain either the α or the β ring form. Within most of these polymers, the C1 hydroxyl groups participate in glycosidic bonds, which prevents ring opening, and therefore the spontaneous transitions between the anomeric forms cannot occur. Starch and glycogen consist of α-d-glucose and yield it during degradation, and this form is also the first substrate in glycolysis.
| 3.2 |
Reactions in glycolysis |
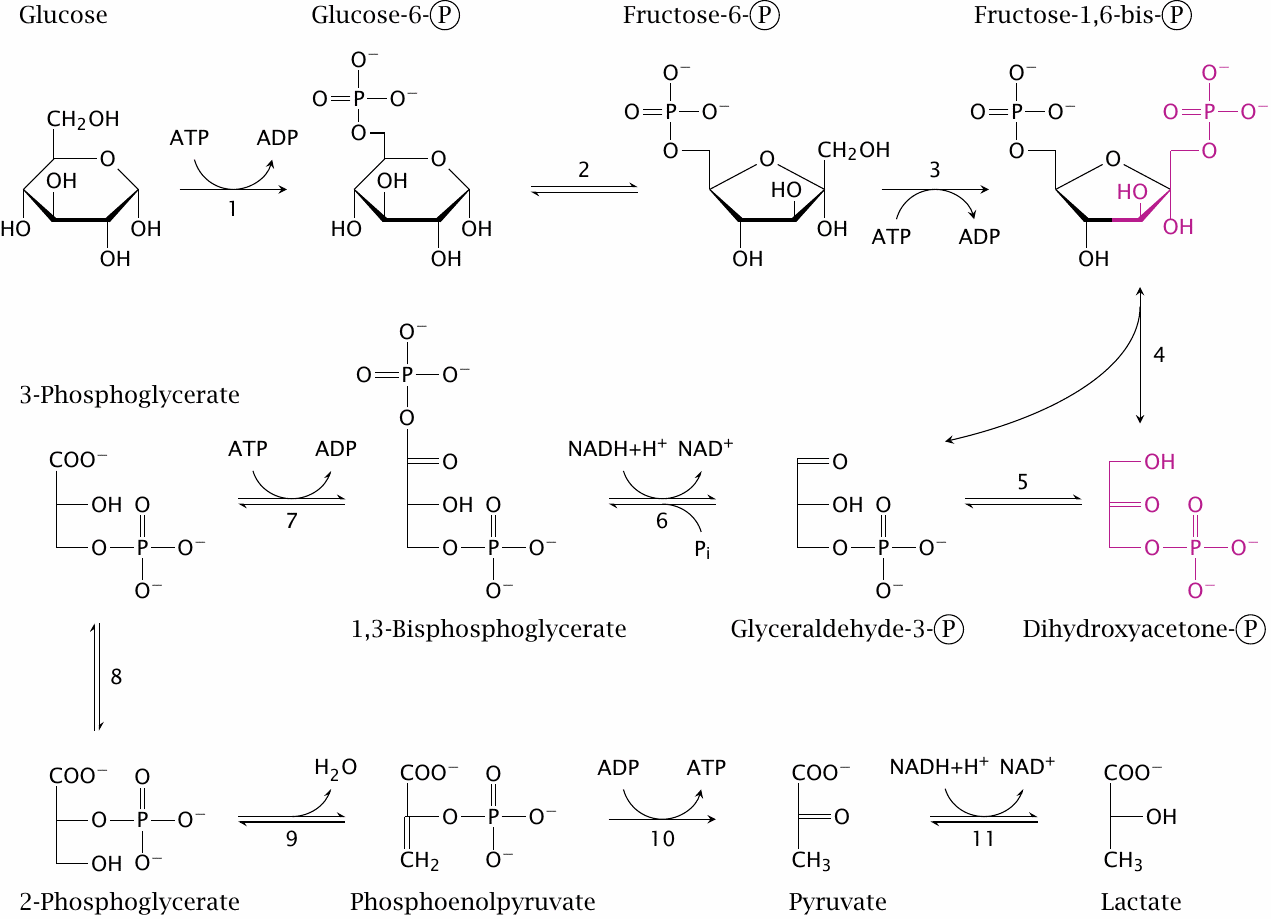
Glycolysis involves ten enzymatic reactions, as follows:
- 1.The phosphorylation of glucose at position 6 by hexokinase,
- 2.the conversion of glucose-6-phosphate to fructose-6-phosphate by phosphohexose isomerase,
- 3.the phosphorylation of fructose-6-phosphate to the 1,6-bisphosphate by phosphofructokinase,
- 4.the cleavage of fructose-1,6-bisphosphate by aldolase. This yields two different products, dihydroxyacetone phosphate and glyceraldehyde-3-phosphate,12
- 5.the isomerization of dihydroxyacetone phosphate to a second molecule of glyceraldehyde-3-phosphate by triose phosphate isomerase,
- 6.the dehydrogenation and concomitant phosphorylation of glyceraldehyde-3-phosphate to 1,3-bis-phosphoglycerate by glyceraldehyde-3-phosphate dehydrogenase,
- 7.the transfer of the 1-phosphate group from 1,3-bis-phosphoglycerate to ADP by phosphoglycerate kinase, which yields ATP and 3-phosphoglycerate,
- 8.the isomerization of 3-phosphoglycerate to 2-phosphoglycerate by phosphoglycerate mutase,
- 9.the dehydration of 2-phosphoglycerate to phosphoenolpyruvate by enolase, and finally
- 10.the transfer of the phosphate group from phosphoenolpyruvate to ADP by pyruvate kinase, to yield a second molecule of ATP.
Most of the pyruvate produced in step 10 undergoes oxidative degradation in the mitochondria. The 11th reaction, catalyzed by lactate dehydrogenase, mostly occurs under anaerobic conditions (see section 3.4), or in those cells that have no mitochondria and therefore lack the ability to oxidatively degrade pyruvate altogether. The latter applies to red blood cells and thrombocytes. Lymphocytes, which do have mitochondria, apparently rely largely on anaerobic glycolysis as well.
Most, but not all reactions in glycolysis are reversible; this is indicated in the slide by double and single arrows, respectively. Because it contains several irreversible reactions, the pathway as a whole is also irreversible. However, as discussed in chapter 7, alternate routes exist that bypass the irreversible reactions and allow glucose to be synthesized from pyruvate.
| 3.3 |
Mechanisms of enzyme catalysis in glycolysis |
Metabolic reactions are catalyzed by enzymes. Enzymes are not magicians but sophisticated catalysts, and their chemical mechanisms are often understood quite well, at least in principle. We will now look at the catalytic mechanisms of several enzymes from glycolysis. Some of these mechanisms will recur in similar form in enzymes from other pathways.
Our first example is hexokinase, which carries out the first reaction in the glycolytic pathway. The kind of reaction that it carries out—the transfer of the terminal phosphate group from ATP onto a hydroxyl group on the substrate—is very common in biochemistry, and we will see more examples in these notes. Since the mechanism of phosphorylation is always the same, it suffices to discuss it once.
| 3.3.1 |
The phosphate groups in ATP are shielded from nucleophilic attack |
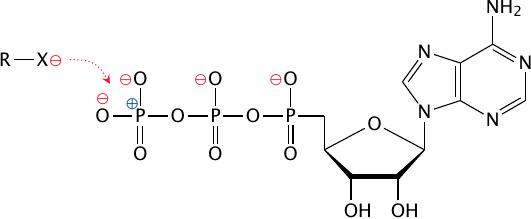
Most reactions that involve the transfer of a phosphate group from ATP to something else are exergonic, that is, they are energetically favorable. For example, the hydrolysis of ATP—that is, the transfer of the phosphate group to water—has a free energy of -35 kJ/mol. It is interesting to note then that ATP is nevertheless quite stable in solution, which means that there must be a high activation energy barrier that resists hydrolysis of the phosphate anhydride bond.
This energy barrier is imposed by the negative charges at the outer sphere of the triphosphate group that shield the phosphorus atoms in the center from nucleophiles which are also negatively charged. Accordingly, to lower this barrier, kinases provide compensating positive charges within their active sites that engage the negative charges on the ATP molecule and thereby clear the way for nucleophilic attack on the phosphorus.
| 3.3.2 |
The catalytic mechanism of hexokinase |
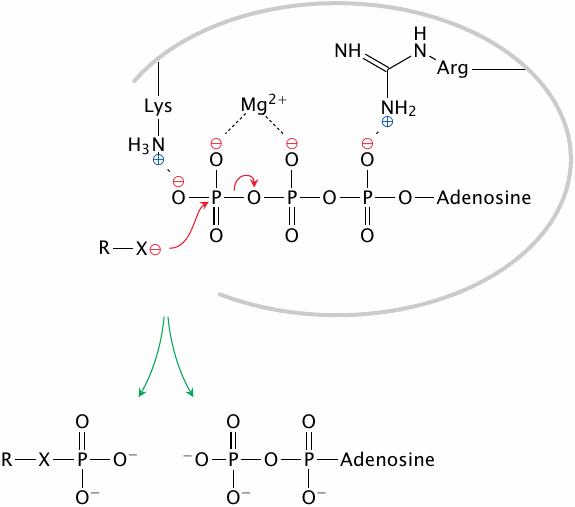
In hexokinase, the negative charges of the phosphate groups are shielded by magnesium ions and by positively charged amino acid side chains in the active site. This facilitates nucleophilic attack by and phosphate group transfer to the substrate.
The charge shielding mechanism solves one problem, but another one remains, namely, how to limit the reaction to the right nucleophile. After all, the most abundant nucleophile in the cell is water, which should make hydrolysis the most likely outcome of ATP activation. This problem is addressed in the next slide.
| 3.3.3 |
Hexokinase envelopes its substrates to prevent ATP hydrolysis |
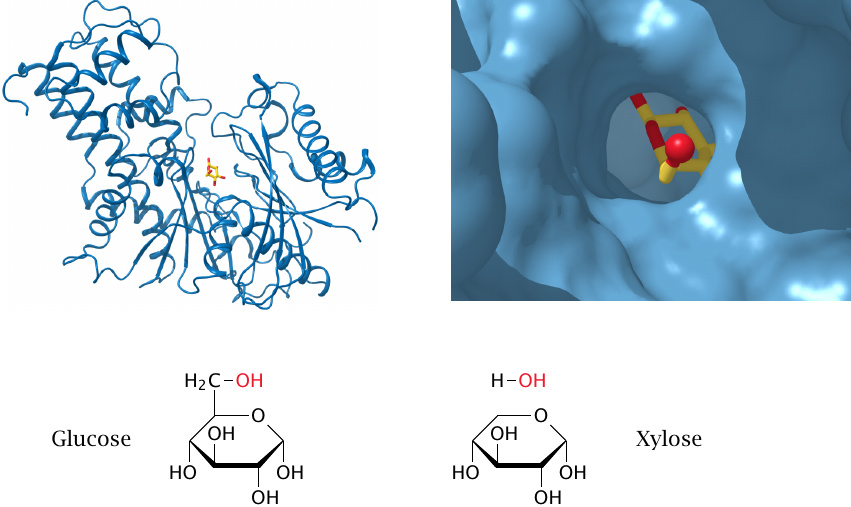
After binding of its substrate glucose (yellow and red) and its cosubstrate ATP (not shown), hexokinase adopts a closed conformation, in which substrate and cosubstrate are buried within the enzyme, and water is excluded from the active site and from the reaction (left). The magnified view on the right shows the C6 oxygen of glucose peeking out of the enzyme’s active site; ATP would occupy the cavity above. (The structures were rendered from 3b8a.pdb.)
If the enzyme is given xylose instead of glucose, one water molecule can squeeze into the active site along with the sugar. This water molecule assumes the place of the C6 hydroxymethyl group of glucose, and it will be activated by hexokinase to react with ATP, which will result in ATP hydrolysis.
| 3.3.4 |
Phosphohexose isomerase performs acid-base catalysis |
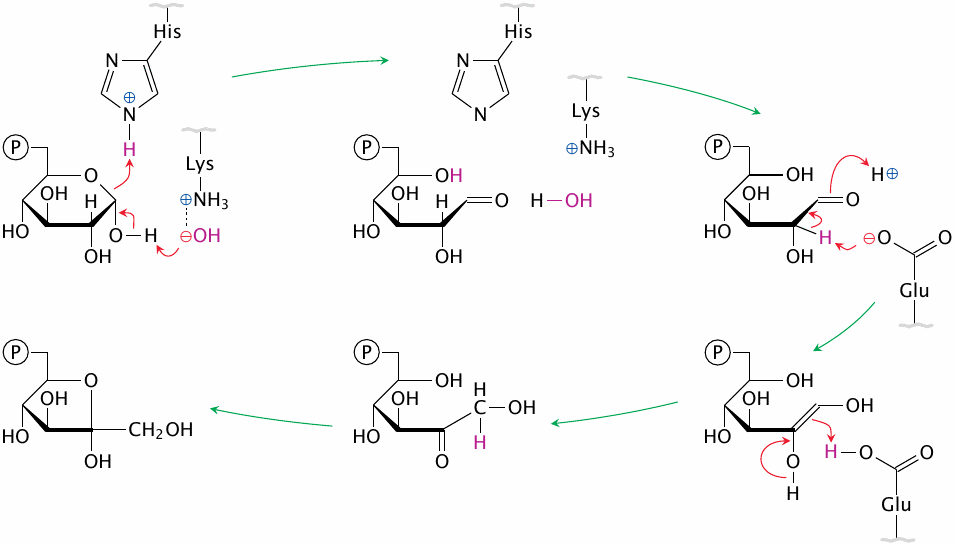
Phosphohexose isomerase provides an excellent example of acid-base catalysis, which involves the reversible protonation and deprotonation of the substrate. The substrate’s hemiacetal bond is opened by the concerted action of a protonated histidine and of a hydroxide ion, which at the outset is bound to a lysine residue. Then, a glutamate residue abstracts a proton from C2 and donates it back to C1, which causes the C=O double bond to migrate from C1 to C2.
Not shown in the picture are several auxiliary charged residues in the active site, which form ion pairs with charges that develop transiently on the substrate, and thereby stabilize the transition state. Closure of the hemiacetal bond in fructose-6-phosphate, which concludes the reaction, is analogous to the initial ring opening and involves the same catalytic amino acid residues [3].
| 3.3.5 |
Glyceraldehyde-3-phosphate dehydrogenase carries out covalent catalysis |
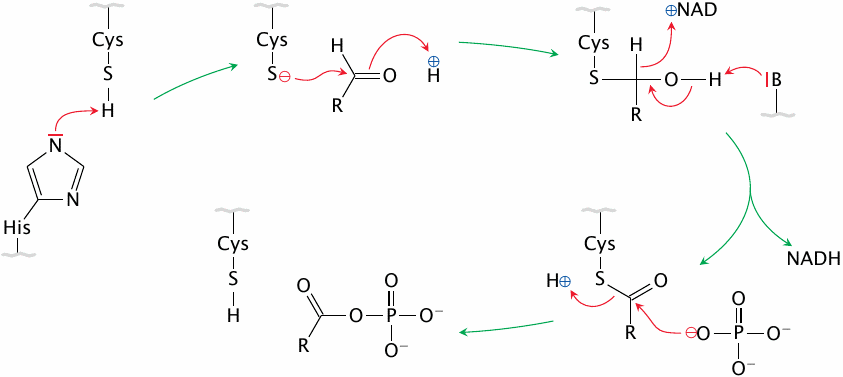
Glyceraldehyde-3-phosphate dehydrogenase provides a straightforward example of covalent catalysis. This reaction mechanism is very common in dehydrogenation reactions, for example in the citric acid cycle and in the β-oxidation of fatty acids. The reaction goes through the following steps:
- 1.A cysteine in the enzyme’s active site is deprotonated by an auxiliary histidine to a thiolate anion (–S−).
- 2.Glyceraldehyde-3-phosphate (shown as R(=O)–H) binds to the active site, and the thiolate performs a nucleophilic attack on its aldehyde carbon. This yields a tetrahedral intermediate state, in which the substrate becomes bound covalently to the enzyme—hence the term “covalent catalysis”.
- 3.The covalent intermediate gives up two electrons and two protons to NAD+ and the enzyme, which yields NADH and converts the substrate to a thioester. NADH leaves.
- 4.The thioester is cleaved by a phosphate ion, again through nucleophilic attack. The product (1,3-bisphosphoglycerate) leaves, and the enzyme is restored to its original state.
The redox cosubstrate used by glyceraldehyde-3-phosphate dehydrogenase, nicotinamide adenine dinucleotide (NAD+), also accepts most of the hydrogen that accrues in the degradative pathways downstream of glycolysis. Its structure and the details of its reduction by hydrogen are shown in slide 3.3.6.
| 3.3.6 |
Structure and redox chemistry of NAD+ and NADP+ |
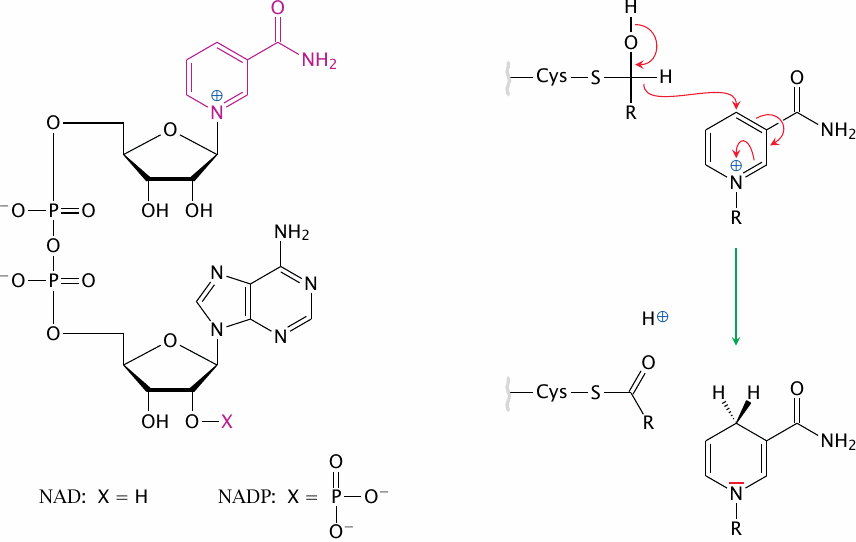
The panel on the left shows the structure of NAD+ and NADP+; the redox-active nicotinamide moiety is highlighted. The panel on the right shows the reduction of this moiety by glyceraldehyde-3-dehydrogenase. The electrons and the hydrogen are transferred from the substrate to the C4 of the nicotinamide. The electrons then redistribute within the ring.
As you can see, NAD+ and NADP+ differ solely by the absence or presence of a phosphate group at the lower ribose ring, which has absolutely nothing to do with the actual redox chemistry. Why, then, is it there at all? It simply serves as a tag that allows NAD+ and NADP+ to interact with separate sets of enzymes. The significance of this duality is discussed in a later chapter (see slide 9.3.1).
| 3.3.7 |
Pyruvate Kinase |
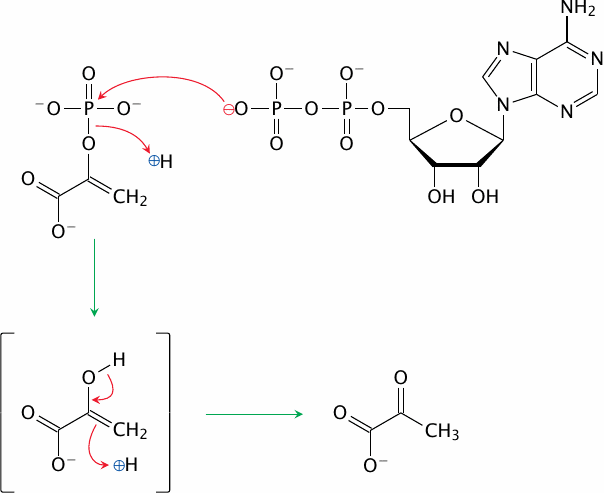
The mechanism of pyruvate kinase is similar to that of hexokinase—except that the reaction proceeds the other way, producing ATP rather than consuming it. Yet, both reactions are irreversible. How can this be?
In the hexokinase reaction, the terminal phosphate of ATP is converted from an anhydride to a phosphoester, which is inherently lower in energy; this makes the reaction exergonic and irreversible. The same also applies to phosphofructokinase and to most other phosphorylation reactions. However, the pyruvate kinase is a special case. Its intermediate product, which occurs immediately after transfer of the phosphate group from phosphoenolpyruvate to ADP, is enolpyruvate. Removal of the phosphate group allows the enol group to rearrange itself into a keto group. This second step of the reaction is sufficiently exergonic to offset the energetic cost of converting the phosphoester to the anhydride, and it thus pushes the overall equilibrium of the reaction towards ATP formation.
| 3.3.8 |
Energy-rich functional groups in substrates of glycolysis |
- the enolphosphate in PEP
- the carboxyphosphate in 1,3-bisphosphoglycerate
- the thioester in the active site of glyceraldehyde-3-dehydrogenase
As you know, the most abundant and important energy-rich metabolite in the cell is ATP. Within this molecule, the energy is stored in the energy-rich phosphate anhydride bonds. Cleavage of these bonds is exergonic, and the energy released by cleavage drives the various reactions and processes powered by ATP. Conversely, in creating ATP from ADP, we require energy to form a new phosphate anhydride bond. We just saw how this energy is derived from phosphoenolpyruvate, and we thus may say that the enolphosphate group is another energy-rich group.
The first ATP in glycolysis is formed by cleavage of the carboxyphosphate mixed anhydride in 1,3-bisphosphoglycerate, and we may thus infer that such mixed anhydrides are energy-rich groups, too. The same functional group also occurs in acetylphosphate and in succinylphosphate, and both of these are capable as well to drive the formation of phosphate anhydride bonds in ATP or GTP.
In slide 3.3.5, we saw that the carboxyphosphate was formed from ionic phosphate and a thioester bond. Since the free phosphate ion is low in energy, it follows that the energy that went into the mixed anhydride came from the thioester. This means that thioesters are energy-rich groups as well.
| 3.4 |
Glycolysis under aerobic and anaerobic conditions |
As we will see in subsequent chapters, the complete oxidative (aerobic) degradation of each glucose molecule yields approximately 30 molecules of ATP. How much of this accrues in glycolysis?
The initial phosphorylation reactions (steps 1 and 3 in slide 3.2) expend two molecules of ATP. One molecule of ATP each is obtained in steps 7 and 10. Since all of the steps from 6 to 11 occur twice per molecule of glucose, the net balance is a gain of two moles of ATP per mole of glucose—a very modest contribution to the final tally. Still, glycolysis is a viable source of ATP, and it is the major one that operates in our tissues under anaerobic conditions, that is, while oxygen is in short supply. This concerns mostly skeletal muscle during maximal exercise, such as a 100 meter dash. As noted above, erythrocytes and some other cell types rely on anaerobic glycolysis even under aerobic conditions.
| 3.4.1 |
Regeneration of cytosolic NAD+ under aerobic conditions |
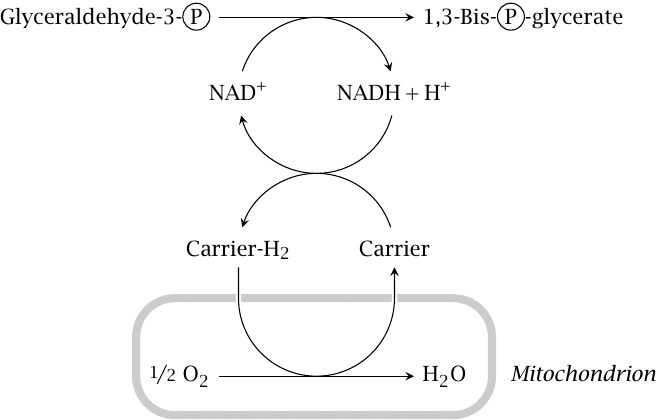
The glyceraldehyde-3-phosphate dehydrogenase reaction (step 6 in slide 3.2) reduces one equivalent of NAD+ to NADH. The concentration of NAD+ in the cytosol is not high (less than 1 mM), and it must therefore be regenerated from NADH in order for glycolysis to continue. Under aerobic conditions, the hydrogen is transferred from NADH to one of several carriers that deliver it to the respiratory chain in the mitochondria, and ultimately to oxygen. These shuttle mechanisms are discussed in detail in section 6.9. Under anaerobic conditions, this is impossible; therefore, other means for hydrogen disposal are required.
| 3.4.2 |
Under anaerobic conditions, NAD+ is regenerated by lactate dehydrogenase |
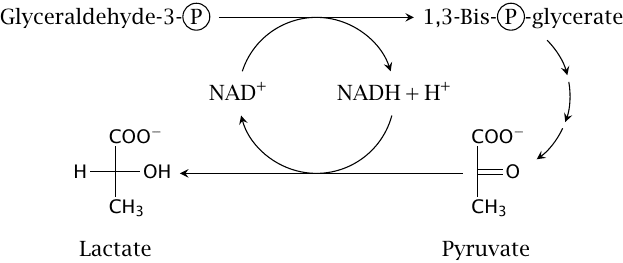
In human metabolism, pyruvate serves as a makeshift hydrogen acceptor under anaerobic conditions; it is reduced to lactate by lactate dehydrogenase (step 11 in slide 3.2). The lactate is released into the bloodstream, where it accumulates; it is removed and recycled after restoration of oxygen supply. The muscle pain caused by lactate accumulation forces us to discontinue anaerobic exercise after a short while.13
| 3.4.3 |
Ethanolic fermentation in yeast serves a dual purpose |
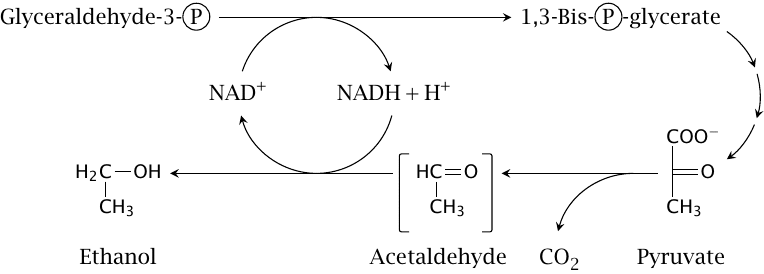
Anaerobic glycolysis also occurs in many microbes, which also face the need to reoxidize NADH. Without the option of reverting to oxidative metabolism within a short time span, they must also deal with the continued accumulation of acid. The yeast Saccharomyces cerevisiae solves this problem through ethanolic fermentation: The acid is converted to a neutral and considerably less toxic compound (ethanol) via decarboxylation. The CO2 developed in this reaction makes bread dough rise up, whereas the ethanol does the same to government tax revenue.14
| 3.5 |
Transport and utilization of glucose in the liver and in other organs |
As was noted in slide 1.6.13, uptake of glucose from the blood occurs by facilitated diffusion and is mediated by GLUT transporters. These occur in several sub-types whose properties are tuned to the physiological roles of different organs.
| 3.5.1 |
Kinetics of glucose transport by facilitated diffusion |
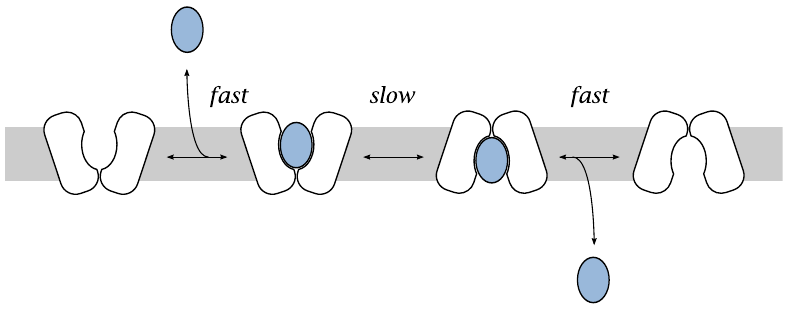
A typical carrier for passive substrate transport alternates between two conformations that are open to either side of the membrane. On both sides of the membrane, the substrate reversibly binds to the carrier protein; binding and dissociation are governed by mass action kinetics. Transport occurs when the protein changes from the outward-facing to the inward-facing conformation, or vice versa, while a substrate molecule is bound to it.
The sequence of events in passive transport resembles the pattern of Michaelis-Menten enzyme kinetics—in both cases, a solute binds reversibly to a protein, which then performs some state-altering action on it. Accordingly, the velocity of transport by facilitated diffusion follows the familiar Michaelis-Menten law:
| \(V_{\text{transport}}\) | = | \(V_{\text{max}}\: \frac{[S]}{K_{\text{M}} + [S]}\) | (3.1) |
where KM is the Michaelis constant, [S] is the substrate concentration, Vtransport is the rate of transport, and Vmax is the maximum rate of transport. This rate is reached at high substrate concentrations, that is, when [S] ≫ KM.
Vmax is proportional to the number of carrier molecules. In many tissues, the number of glucose transporters varies depending on insulin levels. In this way, insulin controls the rate of glucose uptake into cells in these tissues (see slide 13.2.16).
| 3.5.2 |
GLUT transporters in different tissues vary in their affinity for glucose |
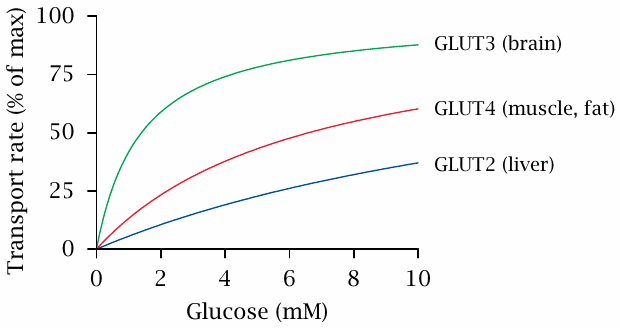
At lower substrate concentrations, the rate of transport becomes dependent on KM, which is inversely related to the affinity of the transporter for the substrate. From equation 3.1, it can be seen that Vtransport will be equal to 1/2 Vmax when the glucose concentration equals KM; therefore, the smaller KM, the more effective the uptake of glucose will be at low concentrations.
The lowest KM—or in other words, the highest glucose affinity—occurs with the GLUT3 transporter subtype, which is found in the brain. Given that normal plasma glucose levels are between 4 and 7 mM, the brain will extract glucose efficiently at both high and low glucose levels. In organs with GLUT subtypes of lower affinity, the rate of uptake drops more significantly as glucose becomes depleted. The decrease in transport efficiency is most pronounced with the GLUT2 transporter, which occurs in the liver.
| 3.5.3 |
Reaction velocities of hexokinase and glucokinase |
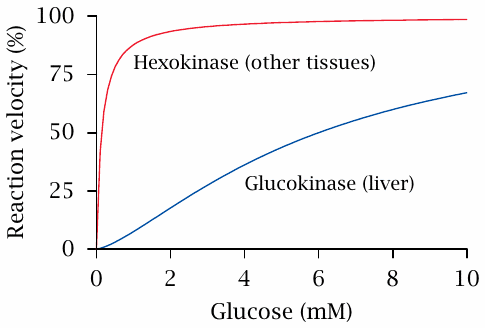
Organ-specific variation of glucose affinity is also observed at the stage of glucose phosphorylation. The liver has a special enzyme called glucokinase, which performs the same reaction as does hexokinase but differs from the latter by a higher KM value.15
Accordingly, in the liver, phosphorylation will proceed more slowly when the level of blood glucose is low, and most of the glucose will be allowed to pass through the liver and make its way into the general circulation. In contrast, at high concentration, the liver will extract a greater share of the available glucose and convert it to glycogen or fatty acids. The kinetic properties of both glucose transport and phosphorylation therefore support the regulatory function of the liver in blood glucose metabolism.
At this point, we must note that the intrinsic kinetic properties of transporter and enzyme molecules are but one piece in the puzzle of glucose regulation. Insulin and several other hormones control the expression, distribution and activity of transporters and enzymes. Hormonal regulation is essential for proper coordination of glucose utilization, as is evident from its severe disturbances in diabetes mellitus and other endocrine diseases (see chapters 13 and 14).
The graphs in this slide and the previous one were plotted using parameters tabulated in references [5–7].