| 14 |
Diabetes mellitus |
| 14.1 |
Introduction |
Apart from atherosclerosis, diabetes mellitus is the most common metabolic disease. It is caused by an absolute or relative lack of insulin activity, which disrupts the regulation and balance of many metabolic pathways. Examining the pathogenesis of diabetes is instructive and a good opportunity for us to recapitulate what we have learned so far.
| 14.1.1 |
What’s in a name? |
- diabetes: “marching through”—urine is produced incessantly
- mellitus: honey-sweet—as opposed to diabetes insipidus (insipid—without flavor)
What does the adjective tell us about a traditional method of diagnosis?
The traditional method of diagnosis was exactly as suggested by this nomenclature. It was effective, though not quantitative. For those of you who aspire to a career in medicine, it may be comforting to know that it is no longer in use.88
| 14.1.2 |
Forms and causes of diabetes mellitus |
| Form | Cause |
| type 1 | lack of insulin due to destruction of β-cells in pancreas islets |
| type 2 | lack of functional response to insulin |
| secondary | excess activity of hormones antagonistic to insulin |
Type 1 diabetes is the form typically observed in the young, whereas the type 2 is more frequent overall and is typically observed in the elderly. MODY—maturity type onset diabetes of the young—is type 2 diabetes in young people.
The causation of diabetes type 1 is well understood: it arises from an immunological cross-reaction that destroys the insulin-producing β-cells of the pancreatic islets, which causes a lack of insulin. In contrast, type 2 diabetics may secrete normal, sometimes even increased amounts of insulin. The hormone also binds to its receptors on the cells in the body, which however fail to respond adequately to this stimulus. In spite of substantial research efforts over several decades, we still don’t clearly understand the reasons for this lacking functional response.
Secondary, or symptomatic, diabetes is diverse. A straightforward example is the excessive secretion of glucagon by a glucagonoma, that is, a benign tumor derived from glucagon-secreting α-cells in pancreatic islets. More commonly, though, secondary diabetes is caused by treatment with high dosages of glucocorticoid hormones in the treatment of auto-immune diseases.
| 14.2 |
Mechanism of renal glucose loss |
The loss of glucose with the urine is a consequence of too high glucose blood levels, which result from the failure of uptake and utilization by insulin-dependent tissues, as well as from various kinds of metabolic dysregulation (see below).
Renal glucose loss is not the most severe symptom of diabetes, but it is nevertheless a prominent one. In order to understand how it comes about, we will first take a look kidney function. This will also provide useful background for some topics in later chapters.
| 14.2.1 |
Overview of kidney function |
Urine is “distilled” from blood plasma in several stages:
- ultrafiltration: 10-20% of the blood plasma volume that passes through the kidneys is squeezed across a molecular sieve; small solutes are filtrated, macromolecules are retained
- solute reuptake: glucose, amino acids, salts etc. are recovered from the ultrafiltrate through active transport
- water reuptake: driven by osmotic gradient
- solute secretion: some substrates are actively secreted into the nascent urine
Blood flows through the kidneys at a rate of ~1.2 l/min, or ~1700 l/day. A bit more than half of that volume is blood plasma, and if we assume a plasma filtration rate of 15%, we obtain a filtrate volume of approximately 150 l/day. Obviously, therefore, most of the water and of the solutes contained in the filtrate must be reclaimed, and only the leftovers appear in the final urine. On the other hand, some solutes are secreted into the nascent urine only after filtration.
| 14.2.2 |
The nephron |
Just as the liver consists of many lobules that each comprise the whole organ function in a small microcosm, the kidney also consists of many instances of a repeating functional unit, the nephron, that comprises all stages of urine production. Each of the two kidneys contains ~1.3 million nephrons that all work in parallel.
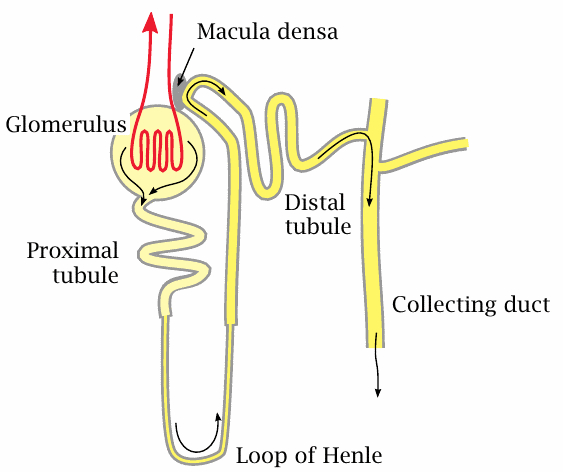
A nephron consists of a glomerulus and a tubular part that can be divided into the proximal tubule, the loop of Henle, and the distal tubule; the latter joins a collecting duct that drains several nephrons towards the exit.
The primary filtrate is formed in the glomerulus. It flows into the proximal tubule, where glucose, amino acids, and most of the salt ions are reclaimed by specific active transporters; water follows by osmosis. More water is reclaimed in Henle’s loop. Along this stretch, a very high salt concentration prevails in the interstitial space of the surrounding tissue, which allows the nascent urine to become significantly more concentrated than blood plasma. Fine tuning of urine concentration, pH and salt content occurs in the distal tubule.
Reuptake of glucose in the nephron occurs through sodium-coupled active transport. The number and capacity of the transporter molecules in the proximal tubules is limited.
| 14.2.3 |
Kidney tissue structure and function: Glomeruli and tubules |
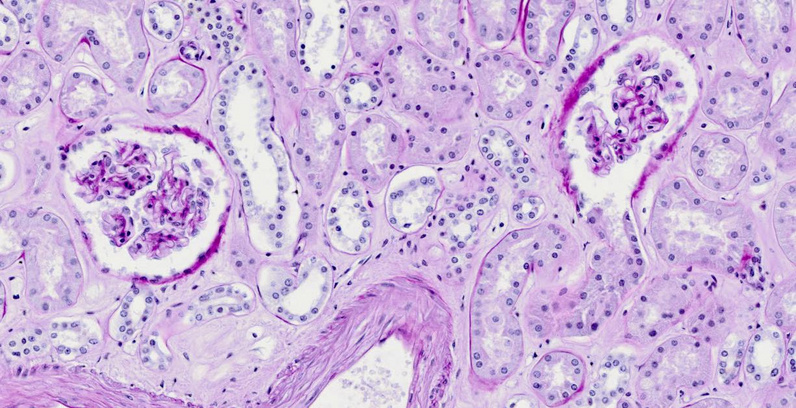
The tissue section shows two glomeruli, surrounded by cross sections of various types of tubules. The sheath containing each glomerulus is known as Bowman’s capsule. In the glomerulus on the right, the capsule has been cut away where it opens into the proximal tubule.
| 14.2.4 |
Primary filtration occurs in the glomerulus |
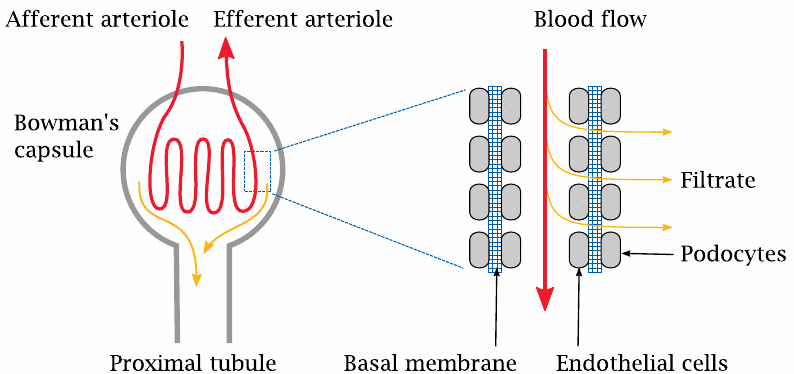
The glomerulus contains a coiled arteriole, that is, a small artery. Unlike the arterioles in the remainder of the body, the endothelium of these glomerular arterioles has gaps. The endothelial gaps line up with gaps in a second cellular layer that is formed by the so-called podocytes and surrounds the outer side of the basal membrane of the arteriole. As with the capillaries in the general circulation, it is the basal membrane that forms the actual molecular sieve in the filtration. The molecular weight cutoff for filtration is similar, too: molecules with less than 10 kDa get across, whereas larger ones are retained. For small molecules that are not retained in the plasma by protein binding, the concentration in the filtrate will be the same as in the plasma. In contrast, proteins and other large molecules should be quantitatively retained inside the arteriole. If proteins do appear in the urine in significant amounts, this indicates that the filtration apparatus is damaged, as is the case for example in glomerulonephritis, an autoimmune disease.
Glomerular filtration is driven by the hydrostatic pressure gradient across the wall of the arteriole. In regular capillaries, the hydrostatic pressure is fairly low, and since it is almost entirely balanced by the osmotic activity of the plasma proteins, very little net filtration occurs (see slide 10.2.4). In contrast, the hydrostatic pressure within the glomerular arterioles is much higher, and therefore filtration proceeds apace.
| 14.2.5 |
Reuptake and secretion occur in the tubular segments |
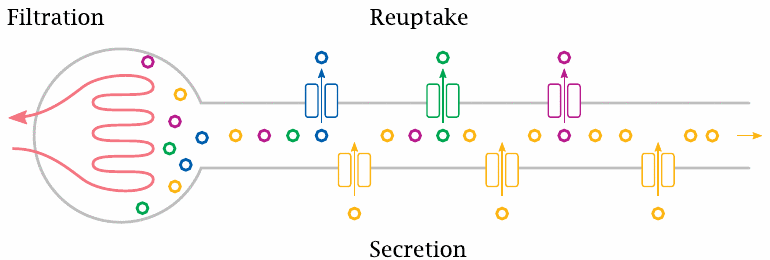
The bulk of the metabolites, including glucose, and most of the water are taken up again in the proximal tubule of the nephron. Other metabolites, such as uric acid (slide 16.5.4), are secreted into the urine in the proximal tubule by active transport. The distal segments of the tubule are concerned with fine-tuning the urine volume, and with the secretion or retention of salt ions and protons according to the currently prevailing metabolic situation.
| 14.2.6 |
The capacity for glucose reuptake is saturated slightly above the physiological plasma concentration range |

The normal range of glucose in the blood is approximately 4–7 mM. Glucose starts to appear in the urine when the plasma glucose level exceeds the reabsorption maximum of ~10 mM. This level is easily exceeded in untreated or inadequately treated diabetics, who are therefore prone to glucosuria. If glucose is detected in the urine, this means that at some time during the last couple of hours the blood glucose must have exceeded the reabsorption threshold. Testing for glucose in the urine can thus be useful in assessing the stringency of glucose control in a patient.
Due to its osmotic activity, glucose excreted in the urine will also cause an increase in the urine volume; this effect is referred to as osmotic diuresis.89
| 14.3 |
Metabolic dysregulation in diabetes mellitus |
| 14.3.1 |
Lack of insulin drives up cAMP |
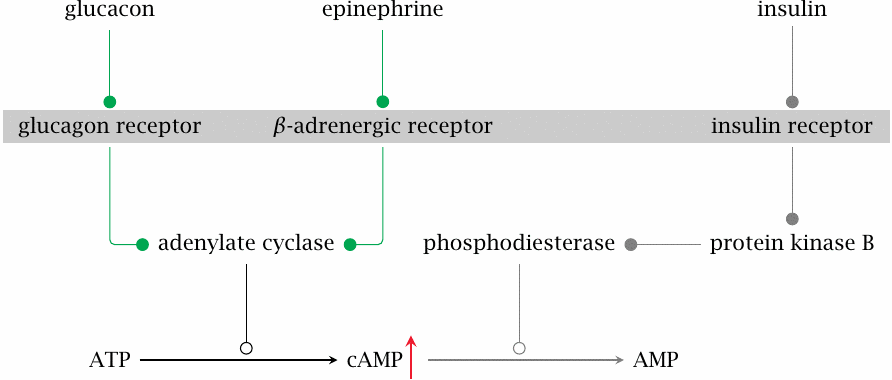
Many metabolic pathways are regulated by the balance between glucagon and epinephrine on the one hand and insulin on the other. The level of the intracellular second messenger cyclic AMP (cAMP) is a key parameter that represents this balance. Glucagon and epinephrine activate adenylate cyclase, which forms cAMP, whereas insulin activates phosphodiesterase, which cleaves cAMP. If insulin is lacking or insulin sensitivity is diminished, the level of cAMP will go up, and protein kinase A (PKA) will be activated.
As we have seen, one of the target proteins controlled by cAMP and PKA is the bifunctional enzyme phosphofructokinase-2/fructose-2,6-bisphosphatase. Phosphorylation of this enzyme activates the bisphosphatase, which lowers the level of fructose-2,6-bisphosphate (see slide 7.5.4). This inhibits glycolysis and activates gluconeogenesis (see slide 7.5.3).
Excessive cAMP levels also affect glycogen metabolism, such that glycogen synthesis is inhibited and breakdown is increased (see slide 8.4.2). Therefore, even though blood glucose is already high to due to lack of cellular uptake in peripheral tissues, both gluconeogenesis and glycogen breakdown in the liver are activated, producing more glucose and further compounding the excessive glucose accumulation.
| 14.3.2 |
Lack of insulin induces triacylglycerol breakdown in fat tissue |
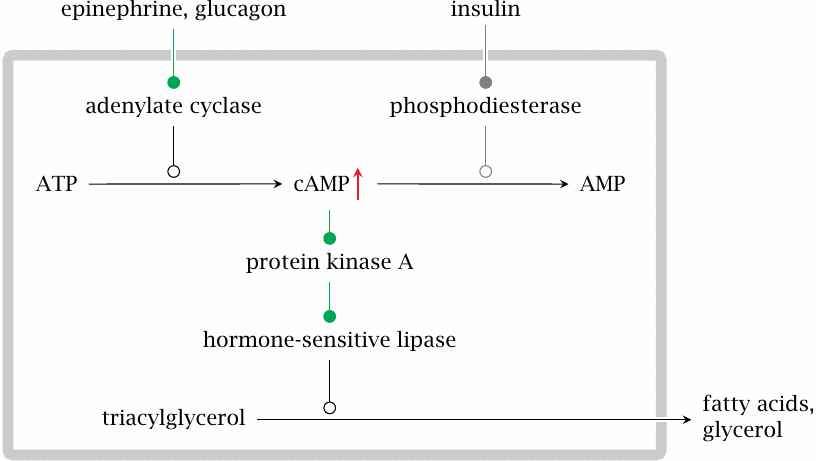
The cAMP/PKA cascade also activates the hormone-sensitive lipase in fat tissue. This enzyme initiates the breakdown of triacylglycerol to free fatty acids and glycerol, which are then released into the blood stream. Glycerol will feed into gluconeogenesis in the liver. Fatty acids may be directly consumed or feed into ketogenesis in the liver.
| 14.3.3 |
Lack of insulin induces protein breakdown in muscle tissue |
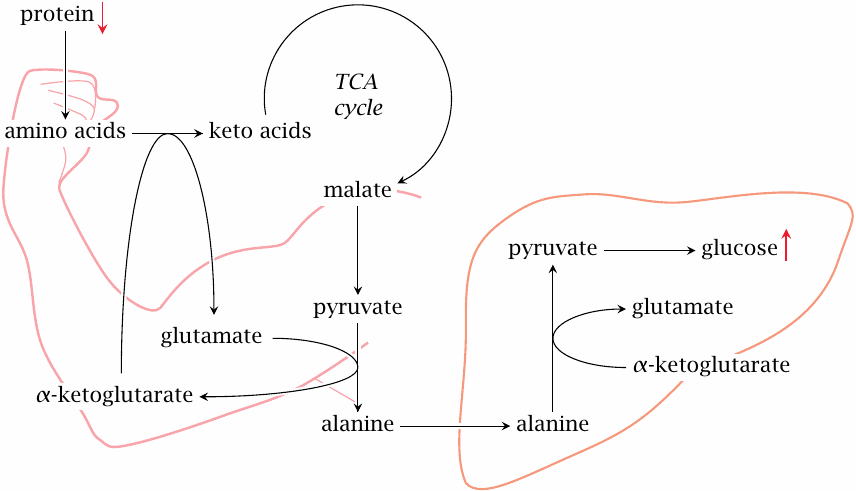
In skeletal muscle, the lack of insulin prevents uptake of glucose, which creates a need for alternative sources of energy. In part, this need is filled by fatty acids and ketone bodies, but additionally protein degradation is activated.90
The amino acid released by protein breakdown also enter degradation. As we have seen, many amino acids are converted to pyruvate or to TCA cycle intermediates (slide 12.1.2); the latter can also be converted to pyruvate by malic enzyme (see slide 9.3.2). Pyruvate is transaminated to alanine, which travels to the liver and enters gluconeogenesis. Alanine formation and transport to the liver also occur as part of the glucose-alanine cycle (slide 12.3.5). The difference between the regular function of that cycle and the catabolic situation in untreated diabetes is that glucose cannot reenter the muscle cells; this greatly accelerates the loss of substrate carbon from muscle.
| 14.3.4 |
Substrate overload in the liver leads to ketogenesis and lipoprotein synthesis |
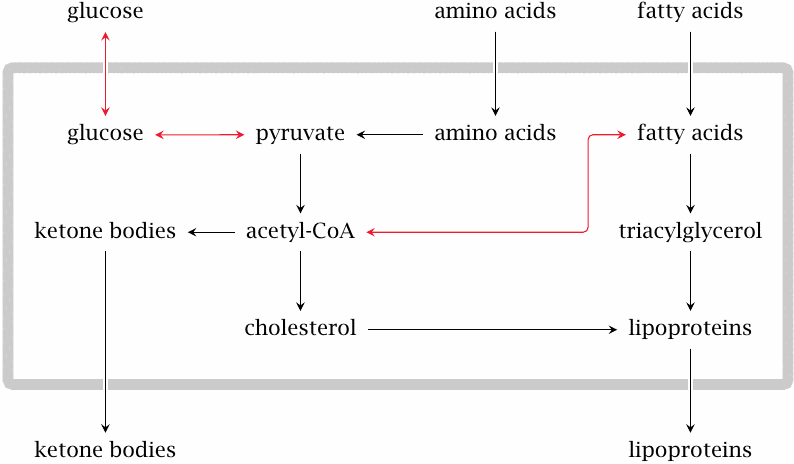
The various causes of glucose accumulation, as well as the accelerated degradation of fat and protein in peripheral tissues, cause a general substrate overload in the liver. At some point, the level of glucose will be so high that glycolysis resumes and pyruvate dehydrogenase starts turning out acetyl-CoA. Some of the free fatty acids mobilized in the fat tissue undergo β-oxidation and produce more acetyl-CoA, whereas others are converted again to triacylglycerol.
A large share of the excess acetyl-CoA is converted to ketone bodies, which will reach plasma levels far beyond those that occur physiologically during starvation. Some acetyl-CoA is converted instead to cholesterol, which together with triacylglycerol is packaged into lipoproteins. The lipoproteins are released into the bloodstream. Elevated blood lipids are a typical finding and contribute to the accelerated development of atherosclerosis in insufficiently treated diabetics.
| 14.3.5 |
Laboratory findings in untreated or under-treated diabetes |
| Observation | Cause |
| increased blood glucose | excessive gluconeogenesis, lack of utilization |
| glucose excreted in urine | capacity for renal reuptake exceeded |
| acidosis (low blood pH) | high plasma levels of ketone bodies |
| increased urea levels | accelerated muscle protein breakdown |
| increased blood lipoproteins | increased synthesis and packaging of cholesterol and triacylglycerol in the liver |
Ketone bodies are fairly strong acids. The kidneys normally compensate for the accumulation of ketone bodies in the blood through the secretion of protons in the form of ammonium chloride. However, the excessive rate of ketogenesis in acute diabetes tends to overwhelm the capacity of the kidneys to balance the blood pH. The condition is referred to as ketoacidosis.91
| 14.3.6 |
Typical symptoms and history in a new case of type 1 diabetes |
| Symptom | Cause |
| dehydration | osmotic diuresis due to glucose excretion |
| acetone smell | acetone forms from acetoacetate, is exhaled |
| coma | both acidosis and blood hyperosmolarity impair brain function |
| loss of body weight | dehydration, breakdown of proteins and fat |
| recent flu-like disease, possibly myocarditis | coxsackievirus infection |
In addition to dehydration and pH deviation, one might consider high acetone levels as an additional cause of diabetic coma, since acetone has documented narcotic activity [90,91]. This possibility has been considered in a study on several patients that had experienced diabetic coma [58]; the authors concluded that plasma acetone levels in these patients fell short of narcotic concentrations.
| 14.4 |
The role of coxsackieviruses in the pathogenesis of type 1 diabetes |
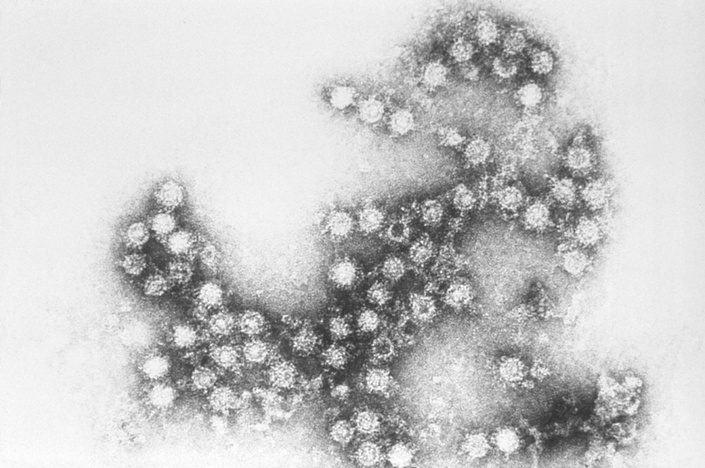
Coxsackieviruses belong to the enterovirus group, like hepatitis A virus and poliovirus. These viruses contain a single-stranded RNA genome and are “naked”, that is, they do not possess a lipid envelope.
Coxsackieviruses can cause non-specific febrile disease but occasionally give rise to pleurodynia, which is characterized by chest pain during breathing that results from the infection of muscles in the rib cage. These viruses may also cause myocarditis, that is, an infection of the heart muscle. You will not be surprised to hear that, of the two, myocarditis is the much more serious condition.
The involvement of coxsackieviruses in the pathogenesis of type 1 diabetes is not due to direct damage to the pancreatic β-cells by the virus; instead, it arises from an immunological cross-reaction between viral antigens with cellular antigens found in the β-cells.
| 14.4.1 |
Outline of T lymphocyte function in antiviral immune responses |
The eradication of viral infections involves cellular immunity, which is mediated mostly by T-lymphocytes. These cells occur in several variants, namely
- T-helper cells,
- T-suppressor cells, and
- T-killer cells (cytotoxic T cells).
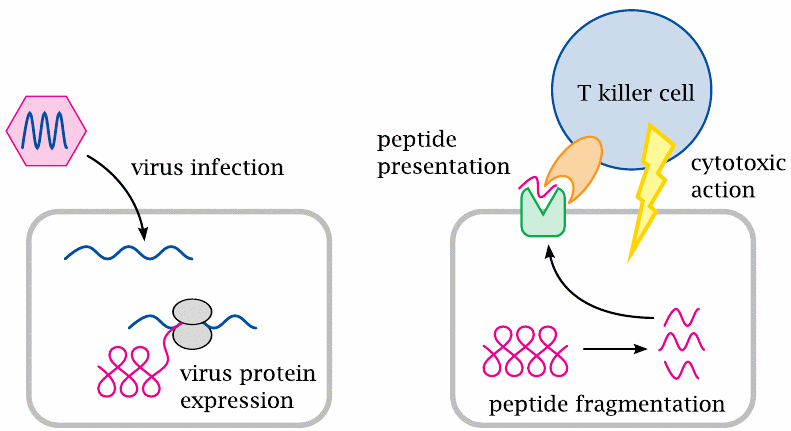
The interaction between lymphocytes and other nucleated cells that enables the lymphocytes to recognize and eliminate virus-infected cells is controlled by two protein molecules. These two proteins are the HLA molecules, which we find on all nucleated cells, and the T cell receptors, which occur only on T lymphocytes.
HLA molecules present potentially antigenic peptides to the T cell receptors. These peptides are samples drawn randomly from the entire set of cellular proteins: As proteins undergo turnover and degradation within the cell, some of the ensuing peptide fragments will become bound to HLA molecules and be transported to the cell surface.92 If the cell is not infected by a virus, these surface-exposed peptides will all be fragments of human-encoded proteins; on the other hand, if the cell is virus-infected, a lot of these peptides will be of viral origin.
The HLA-associated peptides are recognized by T cell receptors. These receptors occur in very many variants that differ in antigen specificity. The variants are produced through combinatorial rearrangement of DNA fragments in the corresponding genes of the T cells, which means that all receptor molecules found on a given T cell, as well as on all of its daughter cells, will be identical.93
Since a T cell receptor arises through a randomized DNA recombination process, its antigen specificity is also random; it may have affinity for a self antigen, that is, a macromolecule that occurs normally in the body and has every right to be there, or for a non-self antigen such as viral protein. Any T lymphocytes that recognize self antigens are normally weeded out by the immune system itself; this is the role of the T suppressor cells.94 In contrast, T helper cells and T killer cells that have no auto-reactive specificity are allowed to persist, since they may have useful affinity for non-self antigens such as viral proteins. Once such a T cell comes across another nucleated cell that happens to present its cognate antigenic peptide, it will bind to this cell and attack it. The T cell-mediated killing of virus-infected cells is a key process in antiviral immune defense.
The random generation of T cell clones with novel antigen specificities may also produce cross-reactive clones that recognize both self antigens and viral antigens. Such clones will usually be suppressed, but occasionally an acute virus infection may intercede and cause them to proliferate before the suppression takes hold. This may then result in damage to cells that express the cross-reacting self antigen. Such a cross-reaction may occur between coxsackieviruses and some self antigens of pancreatic β-cells, causing the destruction of β-cells and giving rise to type 1 diabetes.
| 14.4.2 |
Structure of a T cell receptor bound to its cognate peptide presented by an HLA molecule |
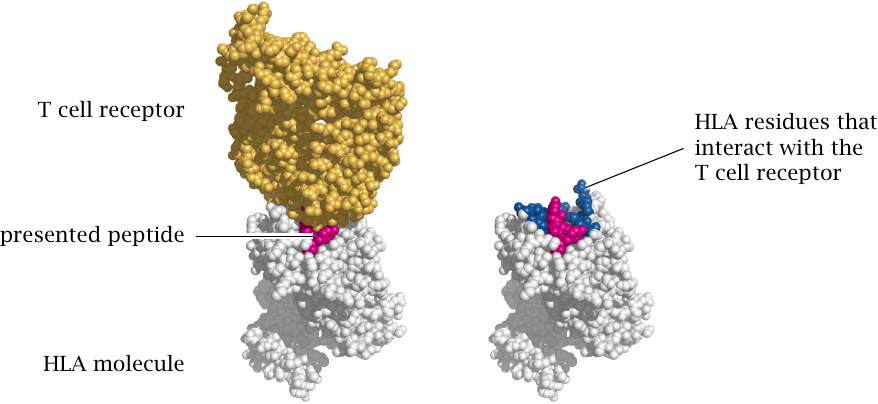
When a T cell receptor binds to an antigenic peptide, it really recognizes the complex of the HLA molecule and the peptide, not just the presented peptide alone. This means that the HLA antigen may augment or reduce the affinity of T cells for the peptide, and thereby modulate the strength of the immune reaction. This holds both for regular immune reactions against viruses or other microbes95 and for autoimmune reactions such as that affecting pancreatic β-cells. Therefore, the risk of developing type 1 diabetes varies substantially between different HLA genotypes. Structures rendered from 1ao7.pdb.
| 14.4.3 |
HLA alleles influence the risk of developing type 1 diabetes |
| HLA-DQ Haplotype | Relative risk | Absolute risk |
| A1: 0301-0302 / B1: 0501-0201 | 21 | 6% |
| B1: 0602 | 0.03 | 0.01% |
The alleles and associated risks listed here are just one illustrative example of the influence of HLA genotypes on the risk of contracting type 1 diabetes. The relative risks are calculated to the average risk of the population; the absolute risks represent the probabilities of contracting type 1 diabetes for persons carrying the allele in question. Note that even among the individuals with the high-risk allele, 94% will not contract diabetes.
| 14.5 |
Therapy of diabetes |
| 14.5.1 |
How to treat a fresh case of acute diabetes |
-
Severely sick, possibly comatose patient
- infusion therapy for fluid replacement, pH and electrolyte adjustment
- parenteral nutrition with proportional insulin substitution
- frequent monitoring of lab parameters (glucose, salts, pH) to adjust therapy
-
Upon stabilization
- reversal to oral nutrition
- train patient to adhere to a stable, regular diet and inject themselves with insulin
- teach patient to monitor blood glucose and to recognize symptoms of hyper- and hypoglycemia
New, untreated cases of diabetes present themselves with different degrees of clinical urgency. The acute illness and coma scenario is more likely to occur in diabetes type 1 than type 2, since in the former insulin secretion subsides acutely, whereas in the latter things tend to go downhill more slowly. Acutely ill patients will require both phases of treatment outlined in this slide, whereas others will seek treatment at less advanced stages and can enter the second stage of treatment right away.
Acutely sick diabetes patients typically have lost a lot of fluid and salts. They are likely in acidosis, that is, their blood pH is too low due to the accumulation of ketone bodies. All these deviations must be corrected by infusion therapy. Insulin is initially administered with the infusion. All components of the infusion, and the flow rate of the infusion itself, are adjusted according to frequent laboratory tests.
When the acute situation has been brought under control, the infusion therapy is terminated and the patient is returned to oral nutrition. The next task is to find out how much insulin this individual patient needs to match their appropriate caloric intake. This usually takes a few weeks of experimentation. Once an appropriate schedule for diet and insulin injections has been worked out and the patient has been properly trained, they can be discharged, which is followed by initially frequent ambulant supervision.
| 14.5.2 |
Kinetics of physiological insulin secretion |
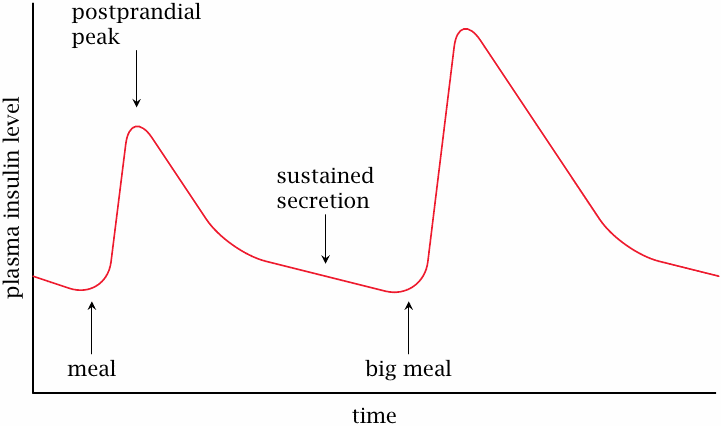
The blood level of insulin rises up rapidly immediately after a meal and then slowly declines over a time course of several hours. The slow pace of the decline is due to sustained secretion of insulin at slowly decreasing rates; individual insulin molecules that have been secreted into the plasma decay much faster, with a half-life of only ~15 minutes. This rapid inactivation is brought about by peptidases in the blood plasma. If we simply inject insulin intravenously, it will be just as rapidly degraded as the endogenously secreted hormone; in fact, this is what happens to insulin that is applied with the infusion treatment in the acute stage.
Continuous infusion is, of course, not practical for long-term treatment; instead, we need a way to mimic the slow, protracted changes of the physiological insulin profile with a limited number of injections per day. The following slides illustrate how this is accomplished.
| 14.5.3 |
The reversible aggregation of insulin delays its diffusion from tissue into the circulation |
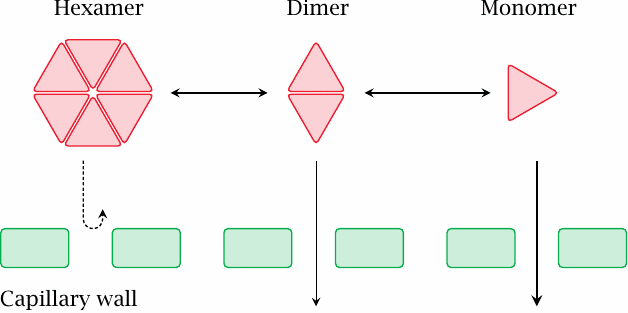
When we inject the insulin into the tissue (typically into the subcutaneous fat tissue—not into the cells, but rather into the fluid-filled interstitial space in between) instead of intravenously, insulin has to diffuse across the walls of the capillaries to reach the circulation, which will occur in a protracted fashion. At high concentration, the extravascular insulin will form hexameric complexes, which are too large to freely diffuse across capillary walls; the required dissociation into dimers and then monomers will further delay the uptake.
The extent of insulin aggregation varies with the ion composition and pH in the preparation. For example, zinc ions stabilize the hexamer, and a low pH induces aggregation of hexamers into larger complexes, from which the insulin will take even longer to fully dissociate. These effects can be used to tweak the intended rate of uptake in clinically used insulin preparations.
| 14.5.4 |
Delayed release of insulin from protamine complexes |
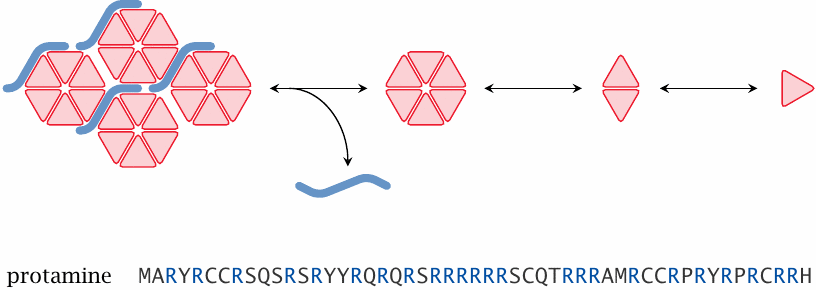
Another effective trick for tweaking the rate of release of insulin is to complex it with protamine, a small, basic DNA-binding protein that occurs in sperm cells. Insulin itself is negatively charged at neutral pH; the two proteins simply cluster together due to ionic interaction.
While protamine complexes and other measures to promote insulin aggregation cause delayed and protracted uptake of insulin into the circulation, another useful technique is to derivatize insulin so as to increase its stability in the circulation. A derivative that has been christened “insulin detemir” carries a fatty acyl residue, which causes it to reversibly bind to albumin; in the albumin-bound state, it is protected from degradation by circulating peptidases.
| 14.5.5 |
Biphasic insulin preparations |
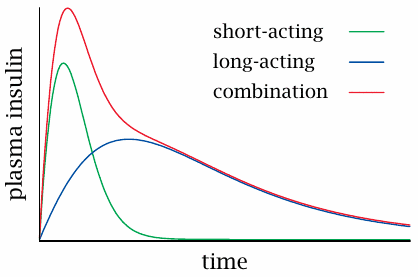
As pointed out above, insulin preparations can be tweaked and tuned for a faster or slower time course of action. In order to mimic both the steep increase and the slow decline of the physiological insulin secretion profile (see slide 14.5.2), fast-release and slow-release preparations are mixed into so-called biphasic insulins.
For many decades, biphasic and slow-release insulin preparations, applied two to three times per day, were most widely used in insulin substitution therapy. However, the accuracy of glucose control that can be achieved with such regimens is limited, and the current trend favors more frequent insulin injections for tighter glucose control. While this is less convenient for the patient, it does help to avoid or postpone long-term complications of diabetes (see below).
| 14.5.6 |
Short-term complications of insulin-requiring diabetes |
| Deviation | Symptoms |
| insulin too low | hyperglycemia, acidosis, …, coma |
| insulin too high | hypoglycemia, coma |
Insulin substitution treatment can go off the rails when the endocrine and metabolic situation of the patient changes, while the insulin dosage does not. For example, acute infections may drive up cortisol secretion, which in turn will raise blood glucose; on the other hand, loss of appetite, vomiting or diarrhea will reduce glucose uptake and blood levels.
In extreme cases, both low glucose levels (hypoglycemia) and excessively high ones (hyperglycemia) can induce coma. Among the two forms, hypoglycemic coma is more common and more immediately life-threatening. Therefore, in case we should find a comatose patient with known diabetes, and we are unable to determine whether he is hyper- or hypoglycemic we would inject glucose first. If the patient wakes up, the patient was indeed hypoglycemic; if not, we would assume the opposite and would then try insulin.96
| 14.5.7 |
Long-term complications of insulin-requiring diabetes |
| Biochemical deviation | Clinical manifestation |
| accumulation of sorbitol in the lens of the eye | cataract |
| increased conversion of glucose to lipids | increased blood fats, atherosclerosis |
| glucosylation of proteins? sorbitol accumulation? | damage to nerve fibres, kidneys, other organs |
Long-term complications of diabetes typically develop several decades after the onset of diabetes itself. They affect a multitude of organs, most notably the vasculature, the peripheral nervous system, and the kidneys. Among these complications, the causation of cataract by sorbitol accumulation is quite well understood (see slide 4.4). Sorbitol accumulation has been suggested as a mechanism in nerve cell damage also, but the evidence is less clear; aldose reductase inhibitors like tolrestat so far have not demonstrated unequivocal clinical benefits [93]. Elevated blood lipids (slide 14.3.4), protein glycosylation (slide 11.6.7), and lack of C-peptide [86] are other potential mechanisms of long-term tissue damage.
Even though the biochemical mechanisms that underlie the pathogenesis of diabetic long term complications are not fully understood, it has been observed that the severity of the clinical picture correlates with the cumulative extent and duration of upward deviations in the blood glucose level.
In the early days of insulin substitution therapy, the blood glucose used to be adjusted to levels somewhat above the normal range; this was done in order to prevent hypoglycemia, which could be acutely life-threatening. However, while sufficient to prevent acute symptoms, this approach favors the occurrence of long-term complications. Intensive insulin therapy (slide 14.5.9) addresses this problem.
| 14.5.8 |
HbA1C as a parameter of long-term glucose control |
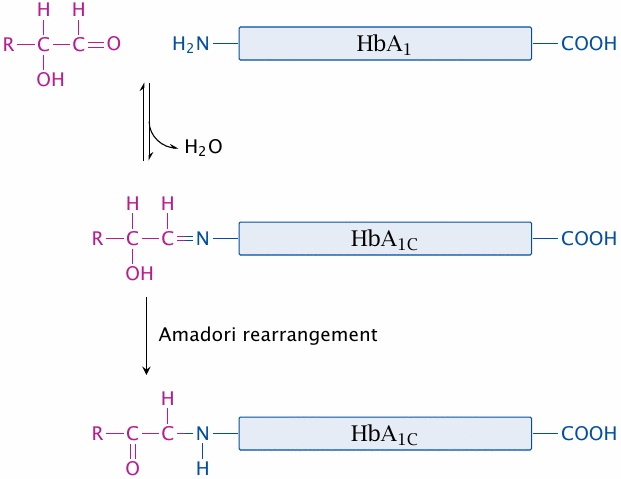
Glucose exists in an equilibrium between the ring-shaped hemiacetal form and the open chain aldehyde form (see slide 3.1.2). The aldehyde form can react with free amino groups of proteins; among the latter, the N-terminal α-amino group has a lower pKa and therefore is more reactive than the є-groups of lysine side chains. The modification becomes irreversible when the initially formed aldimine (Schiff base) undergoes Amadori rearrangement.
Protein glucosylation has been considered as a mechanism leading to the development of diabetic long-term complications, but the evidence is scarce. Whether or not it has a direct role in pathogenesis, it can be used as a diagnostic marker for assessing the metabolic adjustment in diabetic patients. Glucosylation is a slow reaction and occurs over weeks. Therefore, the extent of glucosylation of a long-lived protein such as hemoglobin will indicate how well-adjusted the glucose level has been, on average, for the last 4–6 weeks. This is useful to gauge the quality of metabolic control in patients during intervals between visits to the doctor.
| 14.5.9 |
Intensive insulin therapy |
- rationale: prevent long term complications through tight control of blood glucose
- means: frequent glucose sampling and injections, or continuous insulin application with pump, such that the rate of insulin infusion is controlled by the current glucose level
- challenge: avoid hypoglycemia through insulin overdose—we need to minimize the delay between insulin application and effect
Intensive insulin therapy is increasingly accepted as the best form of treatment, particularly in young patients, who have the most to gain from the postponement of long term complications.
An obvious risk in this therapy is the accidental overdosing of insulin. To control this risk, we need to ensure that any amount of insulin that is applied is also promptly absorbed, so that it does not carry over beyond the time point of the next injection. Mutant insulins have been developed that have an increased rate of uptake. Note that this purpose is the exact opposite to that of preparations such as protamine insulin (see slide 14.5.4).
| 14.5.10 |
Nerdy intermission: delayed feedback causes signal oscillation |
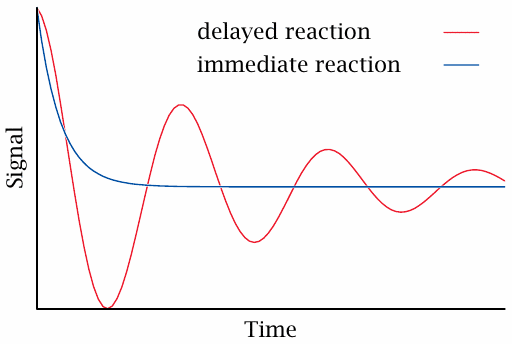
In regular physiology, the blood levels of glucose are connected by a negative feedback loop: As glucose rises, insulin rises and causes glucose to drop; conversely, a dropping glucose level will reduce the output of insulin, which then causes the glucose level to rise again.
Negative feedback loops operate in many places in metabolic regulation and ensure the homeostasis of metabolite levels. For such a loop to be stable and robust, the response to changed input must be swift, since delayed feedback will cause overshooting corrections and induce oscillations.
In intensive insulin therapy, the ideal goal is to replace the function of the physiological glucose-insulin feedback loop. Apart from timely injections of insulin, this also requires that the injected insulin quickly reaches the bloodstream and becomes active. If the insulin effect takes hold too slowly after injection, this will cause delayed feedback and potentially dangerous oscillations of the blood glucose level.
| 14.5.11 |
Structural basis for proline B28 mutations |
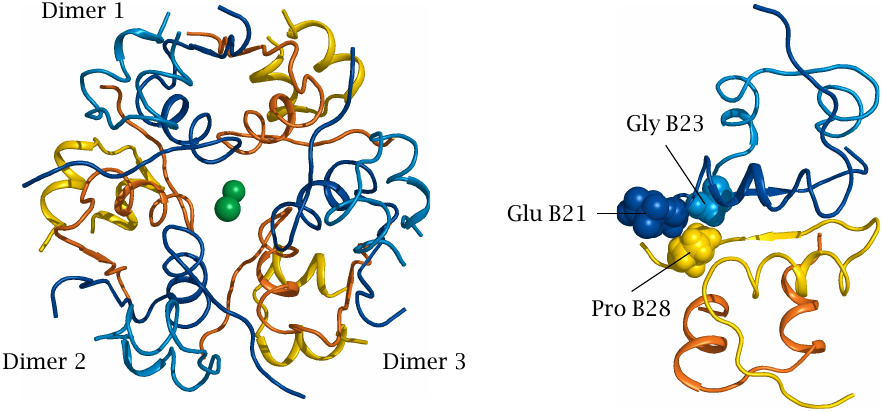
Several insulin mutants optimized for rapid uptake contain substitutions of the proline residue in the 28th position of the B chain. The effects of these mutations can be understood from the structure of insulin aggregates.
The structure on the left is that of an insulin hexamer, consisting of three dimers. In each dimer, one monomer is shown in yellow and the other in blue; the green balls in the center are zinc ions. On the right, it is shown how the hydrophobic proline residue in position B28 of one monomer interacts favorably with the adjacent side chains of the second monomer; this interaction stabilizes the dimer.
Substitution of proline with a charged residue breaks this favorable interaction. In insulin aspart, the proline is replaced with aspartate, which creates electrostatic repulsion with glutamate B21 on the other subunit. In insulin lispro, proline B28 and lysine B29 are swapped, which also reduces the mutual affinity of the adjoining monomers. Mutants like these are currently widely used in intensive insulin therapy.
| 14.5.12 |
Oral antidiabetic drugs |
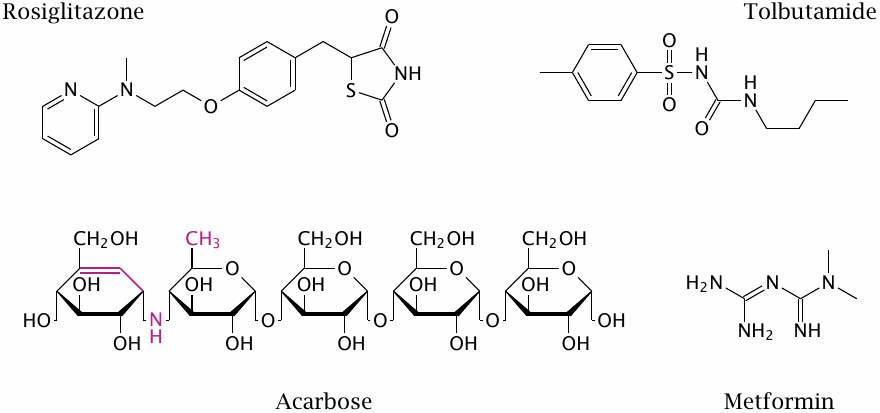
Oral antidiabetic drugs are used only in type 2 diabetes. These structures are just for illustration—no points for memorizing them.
| 14.5.13 |
Action modes of oral antidiabetics |
| Drug | Action mechanism |
| tolbutamide | sulfonylurea receptor agonist |
| rosiglitazone | peroxisome proliferator-activated receptor γ agonist; inhibition of mitochondrial pyruvate transport |
| acarbose | inhibition of the brush border enzymes sucrase and maltase—reduced or delayed glucose uptake |
| tolrestat | aldose reductase inhibitor (withdrawn) |
| metformin | NADH dehydrogenase inhibition ? |
The action mode of tolbutamide was covered earlier (slide 13.2.8). Since its role is to stimulate insulin secretion from pancreatic β-cells, it is clear that it is useless in type 1 diabetes, since most or all β-cells are destroyed in this case.
Rosiglitazone, a thiazolidinedione, reduces insulin resistance in type 2 diabetes. It is an agonist of the PPARγ, a nuclear hormone receptor that regulates the transcription of numerous enzymes and transporters involved in glucose and fat metabolism, but it has numerous side effects including the promotion of heart failure that have led to its withdrawal from the market in Europe. More recently, thiazolidinediones were found to specifically inhibit the mitochondrial pyruvate transporter [94,95]. This should reduce ATP and increase AMP levels in the cell. The next slide, which considers metformin, discusses how an increase in AMP might translate into an antidiabetic effect.
Aldose reductase inhibitors, which are not represented in this slide, have been considered briefly above (slide 14.5.7).
| 14.5.14 |
Hypothetical mode of action of metformin |
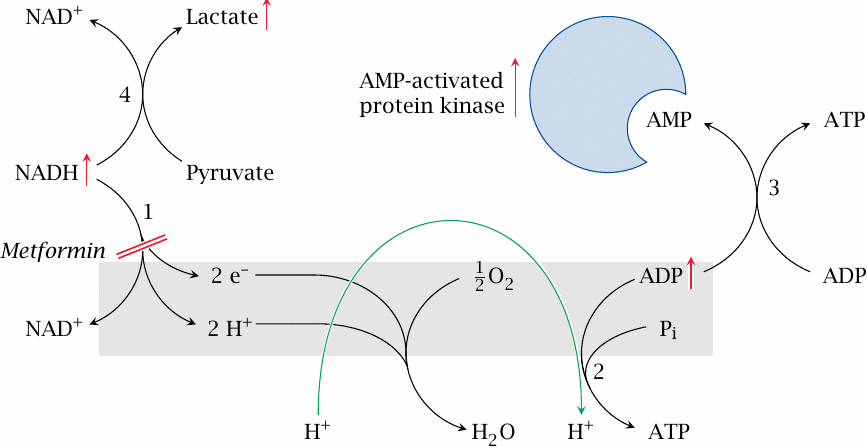
Metformin and related biguanide drugs are probably the most widely used oral antidiabetics. In vitro, metformin has been shown to inhibit NADH dehydrogenase (1), that is, complex I of the respiratory chain. As a consequence, the activity of ATP synthase (2) should drop, too. This would increase the level of ADP, and adenylate kinase (3) should cause AMP to rise as well.
The regulatory effects of AMP resemble some of those brought about by insulin (slides 7.5.3f). In addition, there is an AMP-activated protein kinase that participates in metabolic regulation. Among other effects, this regulatory enzyme activates insulin-independent glucose uptake by cells that normally do require insulin. Another potentially relevant effect of AMP is the inhibition of adenylate cyclase [96], which would counteract the effect of glucagon and epinephrine, and so help to restore the balance between insulin and its antagonists.
If this proposed mechanism is correct, metformin should also cause accumulation of NADH. This would drive lactate dehydrogenase (4) into reverse mode, producing lactate. Lactate acidosis is indeed a known complication of metformin therapy.
| 14.5.15 |
Inhibition of complex I of the respiratory chain by metformin |
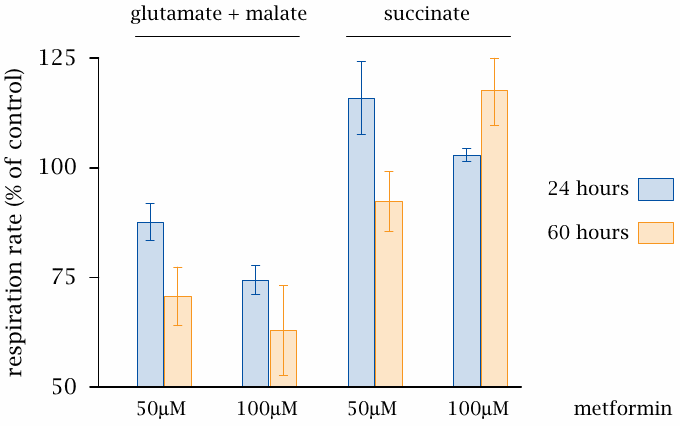
This slide (data from [97]) shows some experiments supporting the mechanism depicted in the preceding slide. Metformin inhibits the respiratory activity of mitochondria when fed with malate but not when fed with succinate. Malate dehydrogenase produces NADH, which delivers electrons to complex I. In contrast, succinate dehydrogenase produces FADH2, which feeds its electrons to complex II and so bypasses the blockade of complex I.
Various aspects of the action mode presented here have been called into question by several experimental studies. One such study attempted but failed to observe the expected concomitant change in the [ADP]/[ATP] ratio [98]. Furthermore, genetic knockout of AMP-activated kinase does not abolish the glucose-lowering action of metformin [99]. Therefore, despite the long-standing clinical use of biguanide drugs, their mode of action is not yet fully understood.