| 2 |
Pharmacodynamics |
| 2.1 |
General principles of drug action |
- Theory of drug-receptor interaction
- The two-state model of receptor activation
- Dose-effect relationships and their modulation by signaling cascades
- Potency, efficacy, and therapeutic index
Drugs act on many different targets and in diverse ways. Nevertheless, there are some general principles of drug action that are applicable to many drugs; these are the subject of pharmacodynamics. In this chapter, we are going to cover the following concepts:
| 2.1.1 |
The invention of the receptor concept |
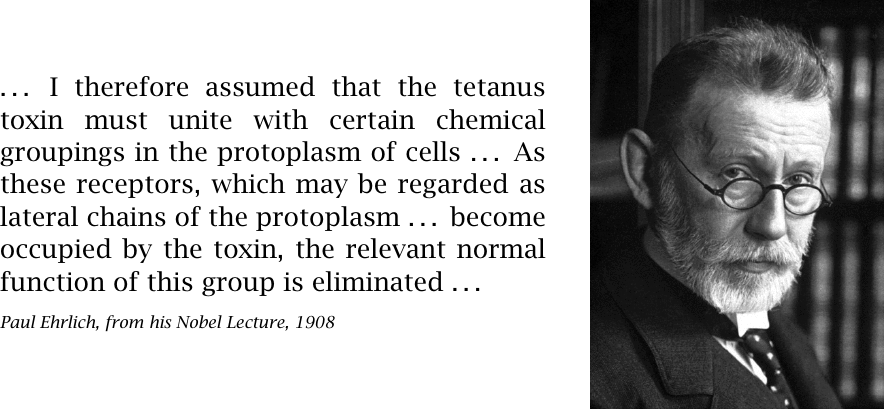
In this excerpt from his Nobel lecture [5], Paul Ehrlich develops the idea of receptor blockade. Although this concept is viable and important, it does not account for the effect of tetanus toxin. Instead, tetanus toxin is a protease that cleaves synaptobrevin, an intracellular protein that is important for neurotransmitter exocytosis (see slide 6.9.1).
The receptor concept is fundamental to pharmacology. As stated above, most receptors are protein molecules; in this chapter, we will confine the discussion to this case.
| 2.1.2 |
How do drugs affect their receptors? |
- Mode of binding: reversible vs. irreversible
- Binding site: orthosteric vs. allosteric
- Functional effect: activation vs. inhibition
Most drugs bind their targets reversibly and non-covalently, but some important exceptions exist. Furthermore, binding is orthosteric in most cases, which means that the drug binds to the receptor within the same site as the receptor’s physiological ligand. For example, all of the antagonists of histamine and angiotensin that were discussed in slides 1.2.3–1.2.8 bind orthosterically. This mode of binding implies that the receptor can not bind its physiological ligand and the drug at the same time; if both are present, they will compete for the same binding sites. Allosteric binding occurs with benzodiazepines, barbituric acid derivatives and several other ligands of the GABAA receptor in the brain (see slide 6.10.8).
A drug that activates its receptor is referred to as an agonist, whereas an inhibitory drug is also called an antagonist. Drugs that target enzymes are virtually always antagonists, while with hormone and neurotransmitter receptors there usually are both agonistic and antagonistic drugs. Where this is the case, only one or the other may have therapeutic value; for example, with histamine receptors, only antagonists are clinically useful. On the other hand, with β-adrenergic receptors, both agonists and antagonists are used as drugs.
| 2.1.3 |
Labetalol as an example of stereoselective drug action |
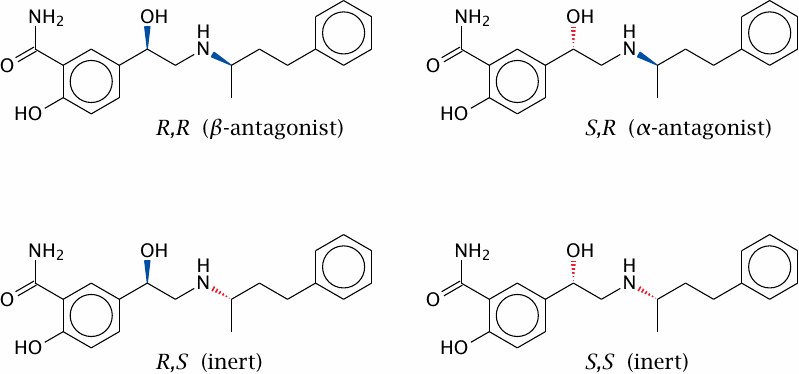
As with enzymes and substrates, the mutual selectivity of receptors and drugs is based to a great extent on the “lock and key” principle, that is, on steric complementarity. Like enzyme substrates, many drug molecules are chiral, which means that they occur as R and S (or l and d) enantiomers. Since proteins consist of l-amino acids only, they are also chiral molecules. Therefore, we should expect protein receptors to interact with drugs in an enantioselective manner. This is indeed the case; a good example of this is the drug labetalol.
Labetalol, an α- and β-adrenergic receptor antagonist, is a racemic mixture of four stereoisomers. The R,R isomer carries most of the β-adrenergic blocking activity, whereas the S,R isomer carries most of the α-blocking activity. The R,S and S,S isomers are dead freight.
Many drugs occur as racemic mixtures, and as with labetalol the isomers will often differ in specificity and activity. Ideally, one would purify or selectively synthesize the isomer that has useful pharmacological activity, and remove others that are inactive and might only contribute to toxicity. However, in practice, achieving stereoisomeric purity may be difficult and costly, and it is usually done only where necessary to avoid significant drug toxicity.
| 2.1.4 |
Two natural stereoisomers with separate therapeutic uses |
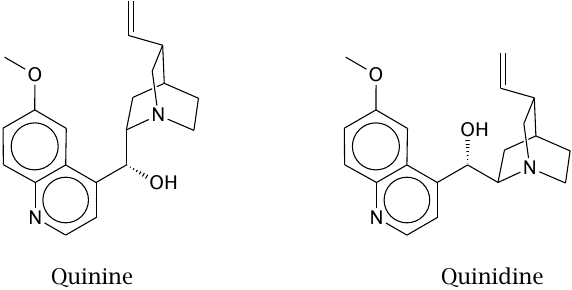
Both quinine and quinidine are obtained from the bark of the Cinchona tree.9 Quinine is used against malaria; its mechanism of action is believed to resemble that of chloroquine (slide 11.9.1).
Quinidine also has some antimalarial activity, but is used in clinical medicine for its inhibitory effect on sodium channels in the heart, which is useful in certain types of cardiac arrhythmias.
| 2.2 |
Mass-action kinetics in drug-receptor interaction |
Both in its assumptions and its conclusions, the theory of drug-receptor interaction is quite similar to enzyme kinetics, and it might be a good idea to dust off your biochemistry textbook to refresh your memory on that subject.
| 2.2.1 |
Mass action kinetics and receptor occupancy |
| \(K\) | = | \(\frac{[\text{L}][\text{R}_{\text{free}}]}{[\text{LR}]}\) | |
| \(\text{Receptor occupancy} = Y\) | = | \(\frac{[\text{LR}]}{[\text{R}_{\text{total}}]} = \frac{[\text{L}]}{[\text{L}]+K}\) |
The law of mass action represents the simplest possible case, but nevertheless an experimentally important one. The key parameter here is the receptor occupancy, that is, the fraction of receptor that is bound to the ligand and therefore subject to the ligand’s functional effect. The second equation assumes that the ligand is present in excess over the receptor, which is almost always the case.
| 2.2.2 |
Linear and semi-logarithmic plots of receptor occupancy |
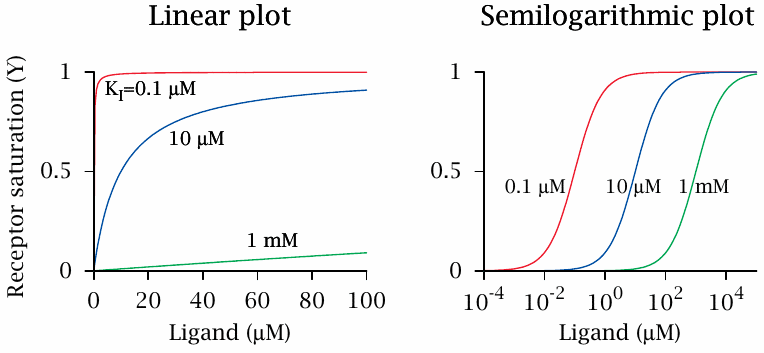
Receptor saturation, as a function of ligand concentration, can be plotted in various formats. The linear plot shows that, at ligand concentrations well below the dissociation constant, receptor saturation increases in an approximately linear fashion. At concentrations significantly greater than the dissociation constant, it approaches saturation and changes very little.
An advantage of the linear plot is freedom from distortion. However, it is not good at covering a wide range of ligand concentrations or affinities, which is often required for comparing different ligands in the same plot. For this purpose, a semi-logarithmic plot—with a logarithmic scale for the ligand concentration—is more convenient. In such a plot, all curves that obey mass-action kinetics are transformed into the same sigmoidal shape. The inflection point of each curve is at Y=0.5 and gives the dissociation constant; the horizontal offset between two curves represents the difference in affinity. We will mostly use this plot format in the following.
| 2.2.3 |
The Scatchard plot |
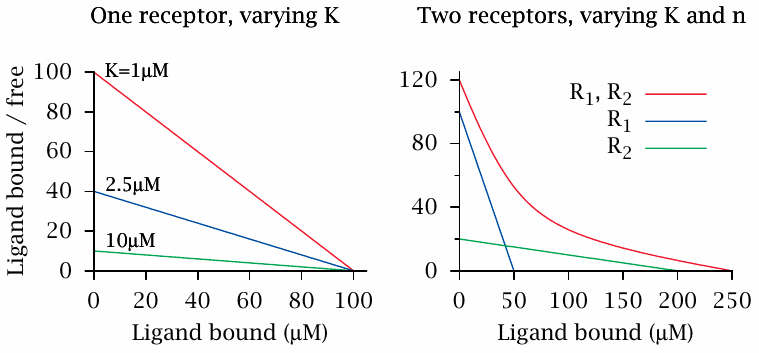
The Scatchard plot is another way to depict the binding of ligands to receptors. In order to construct this plot, the concentrations of both receptor-bound ligand and free ligand are measured, and the ratio of bound to free ligand is plotted against the concentration of bound ligand.
It is easy to show that, if all drug molecules bind to a single class of receptors with uniform affinity, all data points will fall on a straight line. Therefore, if the plotted line is not straight, this suggests that the binding sites are inhomogeneous and vary in affinity. Note, however, that this requires ligand binding to follow simple mass action kinetics, which is not always the case (see slide 2.5.1).
Also note that the Scatchard analysis does not assume that the concentration of the ligand always exceeds that of the receptor—in fact, some of the data points in the curve must be obtained at limiting ligand concentrations; otherwise, the y coordinate would be very low for all data points. This is usually accomplished by the use of radioactively labeled drug molecules, which can be measured accurately at such low concentrations.
| 2.3 |
Reversible and covalent receptor inhibition |
As pointed out above, most drugs bind their targets orthosterically, that is, they dislodge some physiological agonist—such as histamine or angiotensin—from its receptor. If such a drug does not itself activate the receptor, this will cause inhibition.
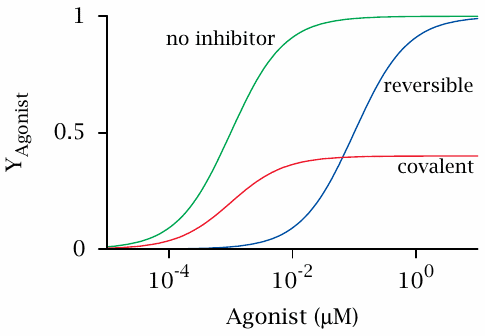
A drug may bind either noncovalently and reversibly, or covalently and irreversibly.10 It turns out that the two cases affect the receptor quite differently: With a reversible inhibitor, the receptor saturation curve for the physiological agonist is shifted to the right, while with a covalent inhibitor it is vertically compressed.
| 2.3.1 |
Theory of competitive inhibition |
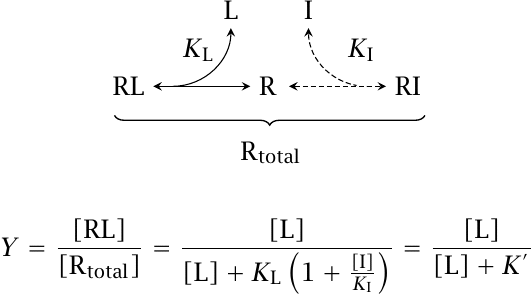
Competitive inhibition occurs when a physiological agonist and an inhibitory drug bind reversibly to the same binding site on their receptor. The two binding equilibria are linked by the free receptor, which can only engage in one reaction at any time.
Let KL and KI be the dissociation constants that govern binding of the physiological agonist and the inhibitor, respectively. Then, if the concentration of the inhibitor [I] is fixed, we can comprise the entire term KL(1 + [I]/KI) into a single number, K′. Since K′ is necessarily greater than KL, the resulting curve in the semilogarithmic plot is shifted to the right relative to the situation without inhibitor, as illustrated in slide 2.3.
Try to derive this equation on a rainy day—it’s all basic high school math. You’ll be glad you did!11
| 2.3.2 |
Theory of irreversible or covalent inhibition |
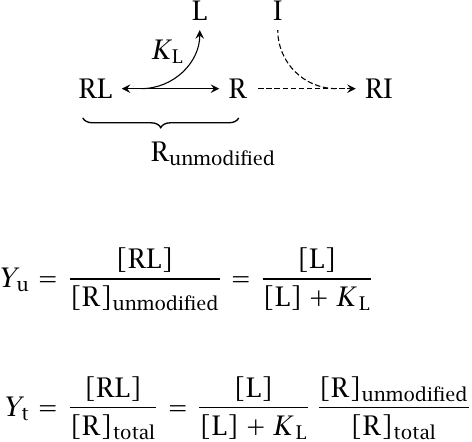
With a drug that inhibits its receptor through covalent reaction, there is no simple way to predict the exact extent to which the receptor population will be affected by the drug. However, after sufficient time, most of the drug will have either reacted with receptor molecules or been inactivated or eliminated in some other way, and the fraction of inhibitor-bound receptor [RI] will no longer change.12 The complementary fraction of unmodified receptor will continue to bind the agonist at equilibrium, governed by KL.
If you compare the second equation to the one given in slide 2.2.1, you will see that irreversible inhibition causes a vertical compression of the simple mass action receptor saturation curve, again as illustrated in slide 2.3.
| 2.3.3 |
Two inhibitors of α-adrenergic receptors |
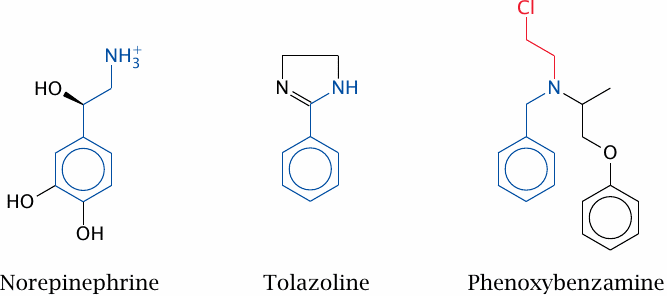
As an experimental example of competitive and covalent inhibition, we will compare two inhibitors of α-adrenergic receptors. These receptors, which are activated by the catecholamine hormones epinephrine and norepinephrine, are found on different cell types. On smooth muscle cells, α receptor activation raises the cytoplasmic calcium concentration, which results in muscle cell contraction.
This slide shows the structures of the physiological agonist norepinephrine, and of the two antagonists tolazoline and phenoxybenzamine.
| 2.3.4 |
Inhibition of spleen strip contraction by tolazoline and phenoxybenzamine |
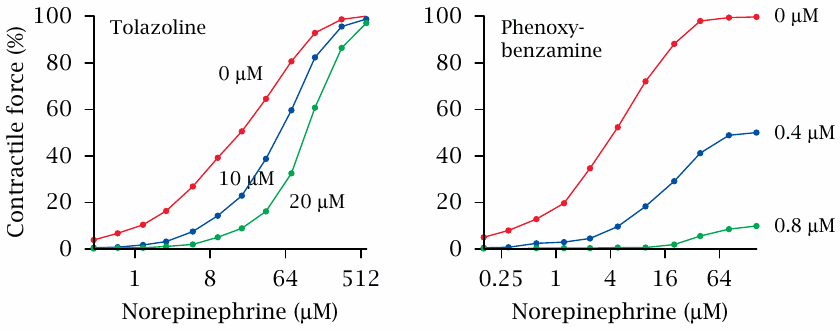
The effect of tolazoline and phenoxybenzamine on α-adrenergic receptors can be observed in spleen strips. The spleen resembles a large sponge that is soaked with blood. Contraction of smooth muscle cells embedded in the spleen tissue will squeeze out the blood and inject it into the circulation. This contraction is triggered by epinephrine or norepinephrine.
The graphs shown here are replotted from original data in [6]. In the experiment, spleen strips were placed between two elastic hooks, bathed in norepinephrine with or without added inhibitor, and the resulting contractile force was measured. If one compares these experimental curves to the theoretical ones shown in slide 2.3, it is pretty clear which inhibitor binds to the receptor reversibly, and which one acts irreversibly.
| 2.3.5 |
Mechanism of covalent receptor blockade by phenoxybenzamine |
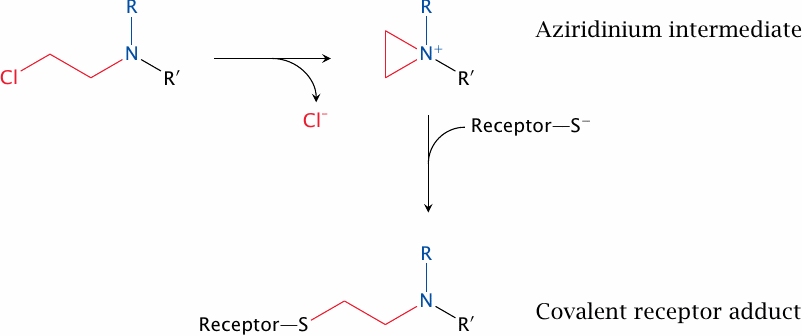
Phenoxybenzamine has a benzylamine moiety that structurally resembles the catecholamines and facilitates its initial, noncovalent binding to the receptor. This sets the stage for the subsequent covalent reaction, which is brought about by the chloroethyl group. This group undergoes spontaneous cyclization to the aziridine derivative, which then reacts covalently with a cysteine residue in the receptor.
Antagonists of α-adrenergic receptors cause smooth muscle relaxation not only in the spleen but in the vascular system in general, and they are useful in the treatment of arterial hypertension. Competitive antagonists such as tolazoline are more widely used for this purpose than covalent ones like phenoxybenzamine. However, phenoxybenzamine is useful in pheochromocytoma, which is a tumor of the adrenal gland that produces and intermittently releases excessive amounts of epinephrine and norepinephrine. These high amounts of hormones could overrule competitive inhibitors, but they will not overcome the irreversible inhibition imposed by phenoxybenzamine.
| 2.4 |
The two-state model of receptor activation |
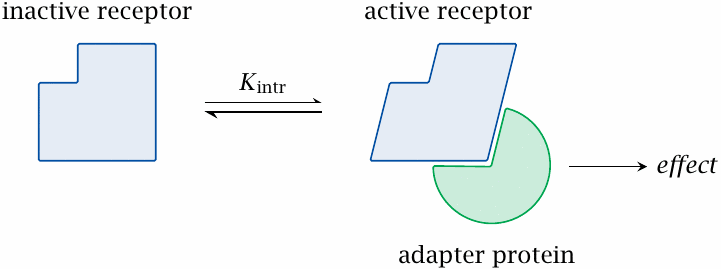
Mass-action theory is good enough for competitive inhibition; however, it cannot explain how agonistic drugs (or physiological ligands) might activate their receptors. The simplest theory to account for receptor activation assumes that a receptor occurs in exactly two conformational states. In one state, the receptor is active, for example because this conformation can bind some adapter protein that triggers the downstream effect; in the other conformation, it is inactive.
The two conformations are at equilibrium. With most receptors, this intrinsic equilibrium favors the inactive conformation; therefore, in the absence of ligands, receptors tend to be inactive. However, the equilibrium will be shifted by ligands that preferentially bind to one or the other conformation.
| 2.4.1 |
Agonist behavior in the two-state model |
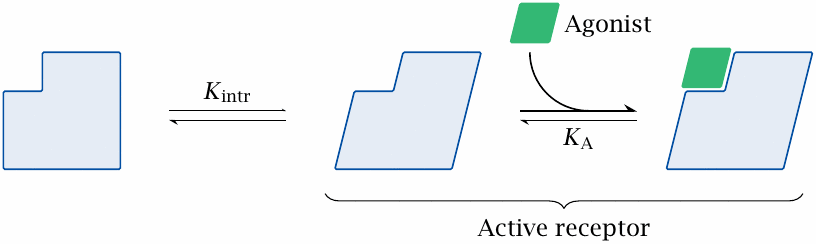
In the two-state model, an agonist is a ligand that binds selectively to the active receptor conformation, according to simple mass-action kinetics. The free energy released by binding will trap a fraction of the receptor molecules in the active state; only the residual fraction of unbound receptor will continue to equilibrate between the active and the inactive conformation.
Note that, if the affinity of the drug for the inactive conformation is indeed zero, the active fraction of the receptor will slightly exceed the ligand-bound fraction. Such a drug is referred to as a full agonist.
| 2.4.2 |
Antagonists and partial agonists |
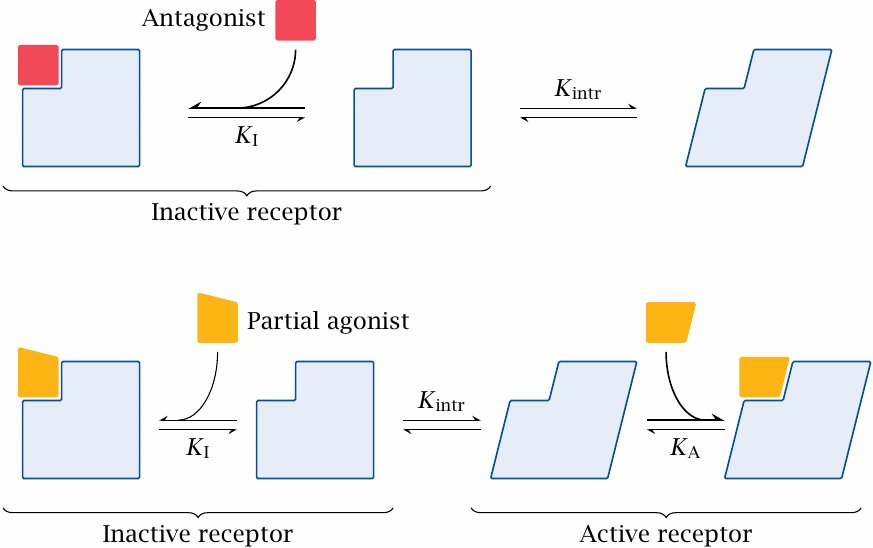
After the foregoing, it will not surprise you that the two-state model explains the effect of antagonists by assuming that they bind selectively to the inactive receptor conformation. In principle, the receptor equilibrium will then be shifted toward this conformation; however, a decreased receptor activity can only be observed if the receptor in question had measurable activity in the unbound state. Antagonists that measurably decrease spontaneous receptor activity are also referred to as inverse agonists.
An interesting case are the partial agonists, which bind to both the inactive and the active states. In order to achieve partial activation, that is, to shift the receptor equilibrium partway mpMihctoward the active state, the drug’s affinity for the active state has to be greater than that for the inactive state.
A drug with exactly equal affinities for the active and the inactive state would not shift the conformational equilibrium at all, and therefore on its own would not change receptor activity. Nevertheless, such drugs are referred to as neutral antagonists; presumably, this is because an antagonistic effect will result when such a drug is applied together with an agonist. Neutral antagonism would seem to be mostly a theoretical case; it would surprise us to find a compound which binds the two different conformations with exactly the same affinity.
| 2.4.3 |
Dose-effect curves in the two-state model |
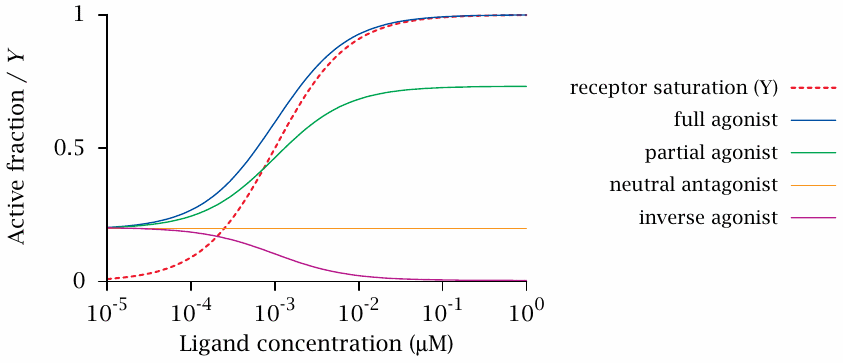
This slide shows numerical examples for receptor active fraction as a function of ligand concentration, for various types of ligands. Each curve represents a different set of values for KA and KI. However, all combinations have been adjusted so as to correspond to the same receptor saturation curve (Y; dashed red line).
At the left end of the x axis, the receptor saturation is negligible, and the y axis intercepts of the active fraction curves reflect the fraction of the receptor that is in the active conformation due to its intrinsic conformational equilibrium. This fraction was arbitrarily set to 0.2,13 which is higher than observed with most real-life receptors. This choice was made to more clearly distinguish the curves for the different ligand types from each other and from the receptor occupancy.
| 2.4.4 |
Application of the two-state model: Effects of aripiprazole on serotonin and dopamine receptors |
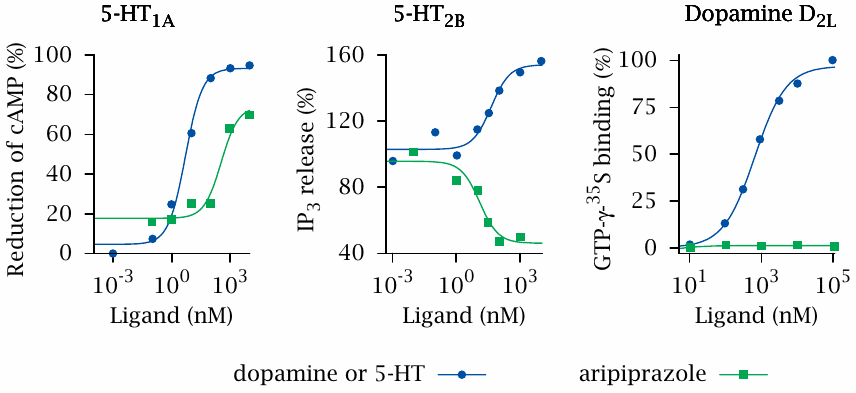
Earlier, we noted that receptors for a given hormone or neurotransmitter may occur in multiple variants (see slide 1.2.3). A drug may bind to more than one receptor variant. Where this is the case, the two-state model allows that a drug may be an agonist on one receptor variant, yet an antagonist at another. Such behavior is indeed observed with the antipsychotic drug aripiprazole, which binds to various serotonin (5-hydroxytryptamine, 5-HT) receptors and also to several dopamine (D) receptors.
In this slide, which shows data replotted from [7], it can be seen that aripiprazole increases the activity of the 5-HT1A receptor subtype, but to a lesser extent than serotonin does; it therefore is a partial agonist at this receptor. In contrast, at the 5-HT2B receptor, aripiprazole is an inverse agonist. It also fails to activate the dopamine D2L receptor. Since this receptor has no detectable basal activity, it cannot be discerned whether aripiprazole is a neutral antagonist or an inverse agonist at this receptor.14
| 2.5 |
Beyond the two-state model |
As we have just seen, the two-state model can account for a fair variety of experimental observations, and accordingly it is widely used in the scientific literature. However, some observations cannot be explained within this model’s rules.
| 2.5.1 |
Cooperative behavior of oligomeric receptors |
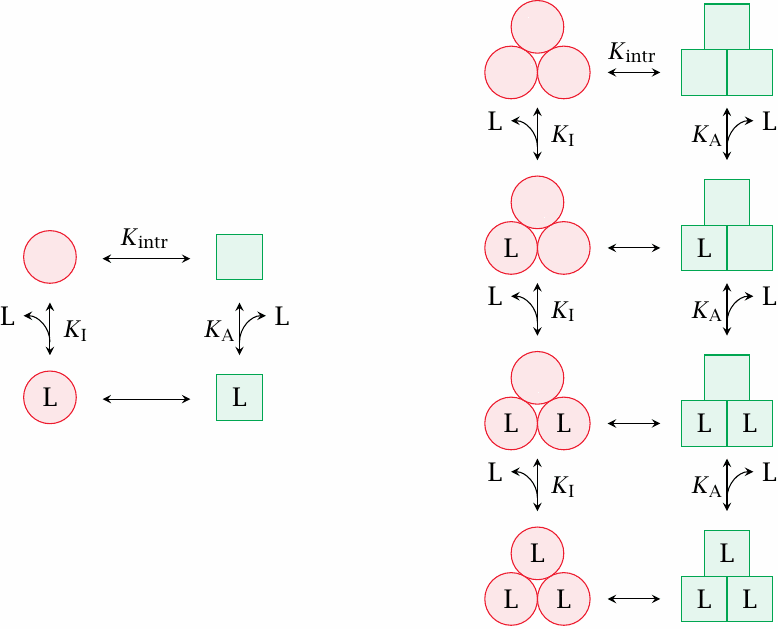
The two-state model assumes mass-action equilibrium for ligand binding to both the active and the inactive state. While this is indeed commonly observed with monomeric receptors, oligomeric ones often bind their ligands cooperatively. In such receptors, individual subunits may still bind the ligand according to mass-action kinetics. However, the subunits are not free to change their conformation individually; instead, the transitions of all subunits are tied together and occur in concert. This changes the shape of both receptor activity and ligand saturation curves, such that they become steeper and sharper than those of comparable single-subunit receptors.15
This slide illustrates a hypothetical receptor that contains three subunits and another one that has only a single subunit. The equilibrium constants—Kintr, Ka and Ki—are assumed to be the same for each receptor subunit, regardless of subunit stoichiometry. In the trimeric receptor, partial conformational changes are forbidden; all subunits change conformation simultaneously, regardless of saturation with ligand.
| 2.5.2 |
Effect of cooperativity on receptor activity |
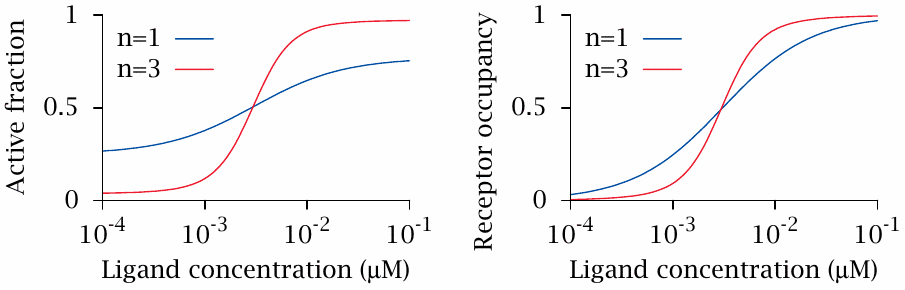
This slide illustrates hypothetical dose-response curves for the two receptors shown in the previous slide. The value of Kintr (1/3) was chosen to favor the inactive conformation only slightly over the active one. In addition, the values of Ka and Ki were chosen so as to make the ligand a partial agonist. With these parameters, the active fraction of the monomeric receptor (left, n=1) shows a rather shallow response to increasing ligand concentrations.
In the trimeric receptor, all the equilibrium constants have been retained; the only change is that the conformational transitions of all three subunits must now occur in unison. This single change suffices to make the transition from the inactive to the active state much steeper and more decisive. A steeper transition is also evident in the receptor saturation curve (right).
What this amounts to is that cooperative receptors have a better signal-to-noise ratio than monomeric receptors. This is an important advantage in cellular signal processing.
You will note that our hypothetical oligomeric and cooperative receptor assumes only two different functional states; therefore, in an intuitive sense, it still conforms to the two-state model; it deviates only with respect to the mass-action kinetics, which we have somewhat arbitrarily stipulated as an element of the two-state model.
| 2.5.3 |
Agonist-specific coupling |
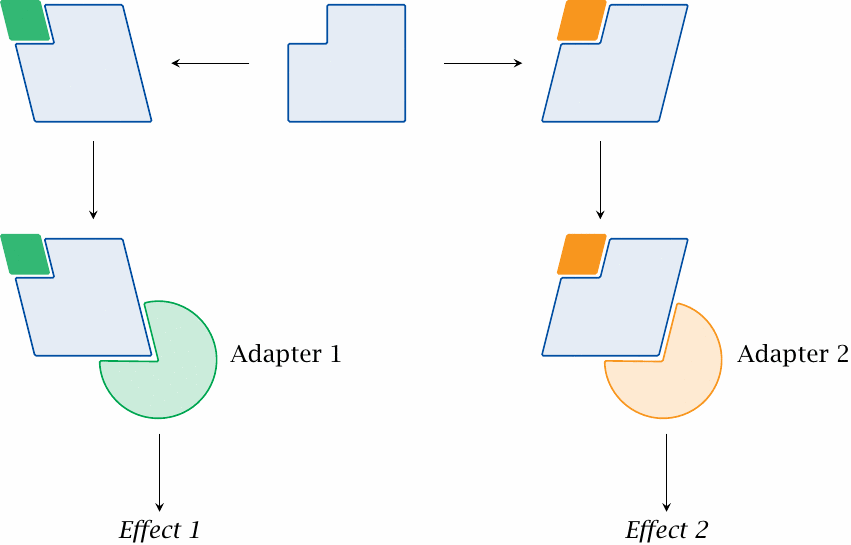
Some receptors couple to more than one adapter protein; the latter can initiate separate signaling cascades inside the cell. With such receptors, it is sometimes observed that a drug activates one of these downstream cascades more strongly than the other. This effect is referred to as agonist-specific coupling or stimulus trafficking.
To understand agonist-specific coupling, one has to assume the existence of more than one active receptor conformation. Agonist-specific coupling therefore cannot be accounted for within the confines of the two-state model.
| 2.5.4 |
Experimental example: Agonist-specific coupling of 5-HT2 receptors |
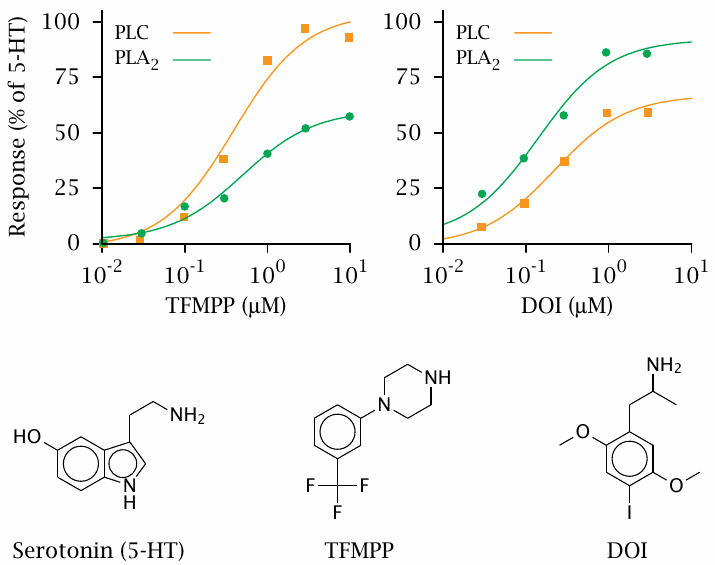
The 5-HT2 serotonin receptor subtype binds two different G proteins. The first one, Gαq, activates phospholipase C (PLC), which releases inositol-triphosphate; the second one, Gα12, indirectly activates phospholipase A2 (PLA2), which releases arachidonic acid.
Two agonists were compared to serotonin with respect to the activation of PLC and of PLA2. TFMPP (3-Trifluoromethylphenylpiperazine) resembles serotonin with respect to PLC activation, but it activates PLA2 to a lower degree. Conversely, DOI (1-[2,5-dimethoxy-4-iodophenyl]-2-aminopropane) shows the opposite behavior. Figure prepared from original data in [8].
While the selectivity of these two drugs for either downstream signalling pathway is not very strong, more compelling examples exist (see for example slide 7.4.5).
| 2.5.5 |
Some receptors have refractory states |
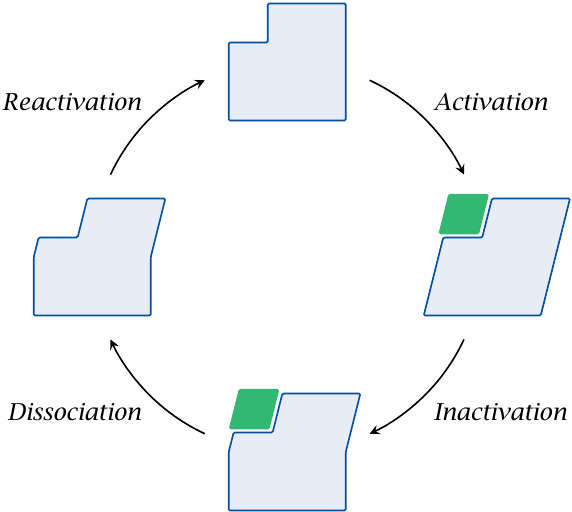
So far, all receptors—whether or not they comply with the two-state model—were assumed to freely go back and forth between active and inactive conformations. However, in some receptors, another functional state exists in which the receptor is functionally inactive and at the same time not amenable to activation.
One receptor that can assume such a refractory state is the nicotinic acetylcholine receptor. This receptor, a ligand-gated ion channel, is activated (opened) by binding of acetylcholine. While still bound to the ligand, the receptor transitions from the active (open) state to its refractory state. As in the inactive state, the channel is now closed; however, as long as acetylcholine remains bound, it cannot be activated again directly. Only once acetylcholine dissociates is the receptor free to revert to the proper inactive state, in which it is once more susceptible to activation (see slide 6.10.6).
Obviously, the existence of such a third functional receptor state is incompatible with the two-state model.
| 2.6 |
Dose-effect relationships in biochemical cascades |
In the nicotinic acetylcholine receptor, it is possible to observe both the binding of a ligand and its functional effect—namely, the conductivity of the closed or open channel—in the same molecule. However, very often, the functional response is observed not in the receptor itself but a good way downstream of it. An example is the contraction of smooth muscle cells induced by norepinephrine (see slide 2.3.4) or by angiotensin (slide 1.2.5). Here, receptor activation triggers a lengthy biochemical cascade that involves phospholipase C activation, calcium release, calmodulin activation, and protein phosphorylation.
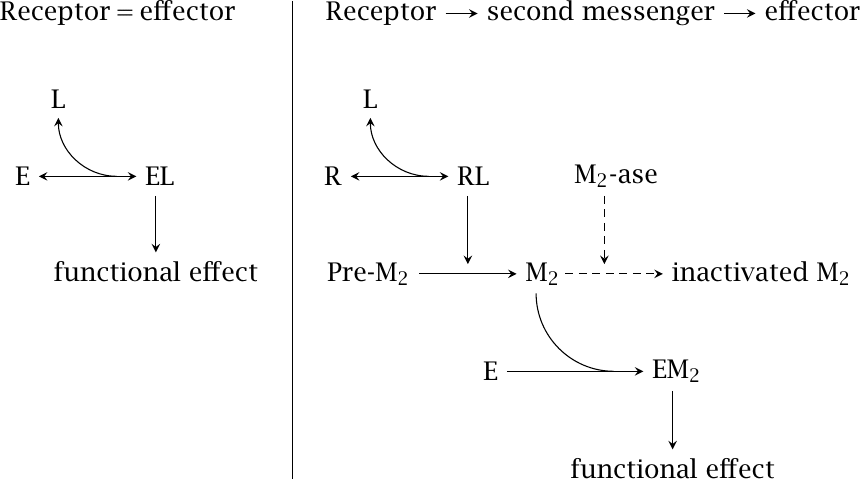
If we observe the effect of a drug on its receptor downstream of such a biochemical cascade, the latter can significantly affect the shape of the measured dose-response curves. To better understand this effect, we will consider a simple model cascade, which is shown on the right hand side of this slide. It consists of a receptor R, a second messenger M2, and an effector E. The following quantitative assumptions were made:16
- 1.Binding of receptor ligand (L) to the receptor, as well as of M2 to the effector, conforms to mass action kinetics. Additionally, the receptor conforms to the two-state model.
- 2.The strength of the functional effect—that is, the response parameter that is plotted along the y axis in a dose-response curve—is proportional to the saturation of E with M2.
- 3.M2 is inactivated by M2-ase, at a rate that is proportional to the concentration of M2 itself.
The next slide illustrates the consequences of these assumptions, using some arbitrarily chosen numerical values for the various parameters of the model.
| 2.6.1 |
The response of a biochemical cascade depends on receptor density |
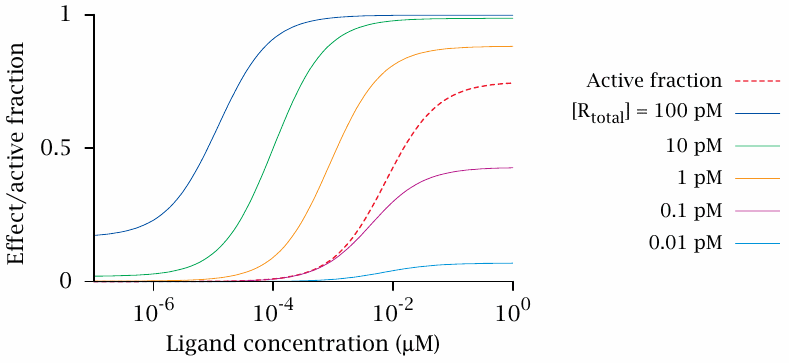
The curves in this graph characterize the behavior of the hypothetical cascade described in the preceding slide. The only thing that varies between the solid curves is the abundance of receptor; imagine, for example, that the receptor is expressed downstream of an inducible promoter that we can activate with some inducer molecule to different degrees.
The dashed curve shows the active fraction (fA) of the receptor (R); notice that this relative value stays the same regardless of receptor density, even though the absolute number of activated receptor molecules does not. The solid curves measure the activity of the effector (E), for different densities of receptor (Rtotal) as indicated. We can make the following observations:
- 1.The ligand is a partial agonist, since fA maxes out significantly below 1. As already noted, fA itself does not change with receptor abundance; therefore, the same fA curve applies to all of the dose-effect curves.
- 2.The maximal receptor response increases with increasing receptor abundance, ultimately approaching 1. Therefore, the ligand, which remains a partial agonist with respect to the receptor, behaves as a full agonist with respect to the downstream response when the receptor density is sufficiently high.
- 3.At higher receptor densities, the dose-response curve also shifts significantly to the left—the effector is already going strong before the receptor even gets out of bed!
- 4.At the highest receptor abundance, the functional response observed without any ligand also becomes noticeable. This is due to our assumption of receptor two-state behavior; with a large enough number of receptor molecules, the small fraction of spontaneously active ones begins to make itself felt.
Cascade effects such as the one modeled here are readily observed in vivo. For example, the contractile force of the heart can be stimulated through β-adrenergic receptors. A half-maximal response can be obtained with just 2% of receptor saturation, and the response will be virtually maximal long before the receptor becomes saturated [10].
Greater than physiological receptor density is often attained when receptors are expressed in cell culture for in vitro studies. We can expect the dose-response curves in such systems to be higher and left-shifted from those that would be observed in vivo.
The opposite effect—namely, right-shifted and vertically depressed curves—can be expected when the receptor density is artificially diminished. This is exactly what we noted earlier with the gradual depletion of α-adrenergic receptors with phenoxybenzamine (see slide 2.3.4).
| 2.7 |
Potency and efficacy |
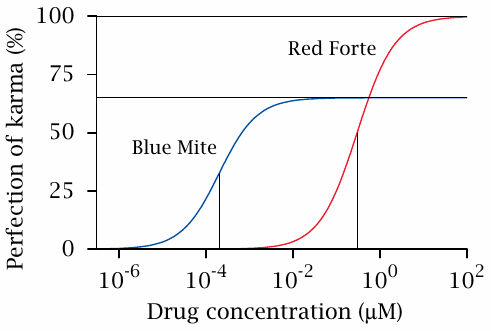
This slide introduces two basic concepts that are frequently used in the characterization of drug activity. The efficacy of a drug is the maximal strength of its effect; therefore, the efficacy of Red forte™ exceeds that of Blue mite©.
The potency is defined as the inverse of a drug’s EC50, which in turn is the concentration at which the drug exhibits 50% of its maximal effect. In our example, the potency of Blue mite© exceeds that of Red forte™.
| 2.8 |
Therapeutic and toxic drug effects |
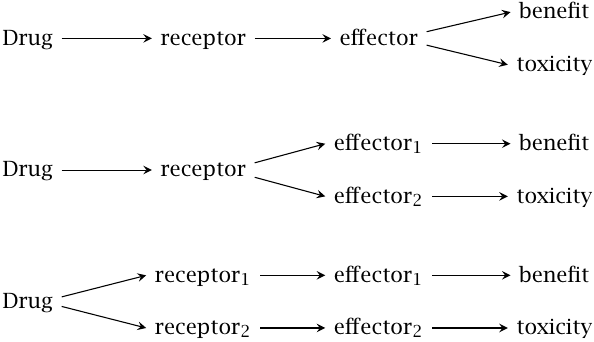
Most drugs exercise not only beneficial but also toxic effects. The two effects may be related in different ways. Toxicity may arise as an extension of the beneficial effect and be unseparable from it (top). For example, barbituric acid derivatives exercise a useful sedative effect but become narcotic and finally lethal with increasing dosage; all of these effects arise from activation of the GABAA receptor in the brain. Such drugs tend to have a low therapeutic index or therapeutic range, which means a low ratio of toxic over therapeutic concentration.
At the other end of the scale (bottom), toxicity and benefit arise downstream of entirely separate receptors, both of which are activated by the same drug. In this case, it is desirable to develop a drug with specificity for the receptor that mediates the beneficial effect; we have already discussed the histamine H2 receptor antagonists as an example.
Finally, it is also possible that benefit and toxicity arise downstream of the same receptor, but that their respective signaling chains diverge at some point upstream of the ultimate effector molecules (middle). In such cases, it may be possible to avoid toxicity by developing drugs that act downstream of the branching point.
An example of this latter case is provided by antagonists of the nicotinic acetylcholine receptor. These drugs reduce blood pressure and have been used in the past to treat hypertension. However, since they inhibit both the sympathetic and the parasympathetic nervous system (see slide 6.13.2), they are prone to side effects. Drugs that act specifically on downstream receptors, such as the adrenergic receptors of the sympathetic nervous system, have better selectivity and fewer side effects.
This figure was adapted from one found in [11].