| 6 |
The evidence of neutron radiation |
This chapter examines the evidence pertaining to radioactive isotopes whose formation is ascribed to the neutron radiation released by the Hiroshima bomb. It will show that
- the spatial distribution of 31P formed in sulfur samples by the capture of fast neutrons is inconsistent with the activation by a single nuclear detonation at the claimed altitude of 600 m;
- the very small number of samples which have been analyzed for multiple isotopes yield contradictory information regarding the date of activation and the neutron energy spectrum;
- the dosimetry scheme DS86, which drastically lowered the neutron dose estimates for Hiroshima, was at the time of its inception plainly contradicted by the evidence. While some supporting results have since been published, the discrepancies between these ‘fresh’ data and the older ones have not been convincingly explained.
The purported evidence of neutron radiation is thus replete with inconsistencies and cannot be trusted.
| 6.1 |
Neutron dose estimates in the T65D and DS86 dosimetry schemes |
We have discussed earlier that a proper nuclear bomb should release both γ- and neutron radiation. The study by Robert Wilson [73] appears to be the earliest attempt to quantify the amounts of both forms of radiation released in Hiroshima and Nagasaki. Noting that he has very little in the way of physical data to work with (see quotation in Section 4.1), he does his best to come up with reasonable estimates, but he cautions that his numbers—particularly those for fast neutrons, which are particularly important with respect to biological effects—are “merely guesses.”
Experimental study of this problem began in the late 1950s; this work resulted in the T65D dosimetry scheme [36] (see also Chapter 11). According to T65D, neutron doses had been much higher in Hiroshima, where they accounted for a substantial fraction of the total radiation dose, than in Nagasaki, where γ-radiation had been dominant. This was a consequence of the different bomb designs: the Nagasaki bomb had been enclosed with a large amount of chemical explosives, whose constituent ‘light’ elements would have stopped neutrons much more effectively than γ-rays. In contrast, the casing of the Hiroshima bomb consisted exclusively of metal elements; it would have attenuated γ-radiation more effectively than the Nagasaki bomb’s enclosure, while being more permissive toward neutrons.
| 6.1.1 |
Propagation of neutron fluences in observed in bomb tests |
Many of the experimental studies that led to the T65D dosimetry scheme were carried out in conjunction with the bomb tests then ongoing in the United States. To study the reach of the neutrons released in a detonation as well as their fluence, that is, the total number of neutrons striking a given area on the ground, suitable detectors were placed at different distances from the detonation. These detectors contained non-radioactive elements able to capture neutrons and thereby become radioactive;69 from the radioactivity thus induced, the neutron fluence could be inferred. Furthermore, to characterize the energy spectrum of the neutrons, several different precursor elements were employed that preferentially capture neutrons of different energies.
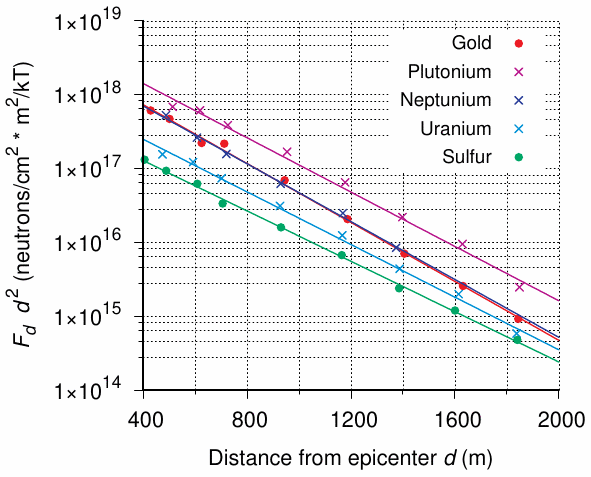
Figure 6.1 depicts some such measurements, which were reported by Auxier [36]. In the figure, the data have been plotted according to Equation 2.11, which corrects the fluence for radial divergence from the epicenter (see Section 2.7.4). We see that all data can be described fairly well with straight lines. Since the y axis is logarithmic, this means that the simple approximation of exponential attenuation along a straight path summarizes the results rather well, even though it does not accurately reflect the way neutrons interact with matter (cf. Section 2.4.4). We do note that the slopes, and therefore the relaxation lengths,70 vary somewhat between elements. The steepest decline, and therefore the shortest relaxation length (218 m) is found with gold, which captures very low-energy (thermal) neutrons, whereas the highest relaxation length (255 m) is observed with sulfur, which also captures the neutrons which are highest in energy (> 2.5 MeV). We note that overall the effect of neutron energy on relaxation length is modest.
The average relaxation length of all five elements shown in the figure is 235 m. However, these measurements were carried out in Nevada, at an altitude of more than 1000 m and presumably in fairly dry air. Both Hiroshima and Nagasaki are at low elevation and very near the sea, with denser and typically more humid air. Both factors will cause more rapid attenuation of neutrons; and this is indeed reflected in the T65D dosimetry scheme, which assumed a neutron relaxation length of 198 m meters for both cities.
At practically important distances from the detonation—that is, on the ground—the T65D dosimetry model assumes a single relaxation length for all neutron energies [36]; in contrast, the neutron propagation calculations given by other authors [87,88] are better approximated with the use of different relaxation lengths for neutrons of low and high energy, respectively. In the following, we will use either approach as appropriate.
| 6.1.2 |
The source spectrum |
The range of neutrons traveling through air depends on their kinetic energy. Once they have lost all their initial energy and merely keep bouncing around in thermal equilibrium with the surrounding gas molecules—that is, once they have become thermalized—they will quickly be captured by nitrogen atomic nuclei, which will end their independent existence. It may thus be surprising at first glance that slow neutrons reach the ground at all. The explanation is that the slow neutrons observed at e.g. 1200 m did not escape the bomb as such; instead, they escaped as fast neutrons that were progressively slowed down by multiple collisions with atomic nuclei in the air. Thus, only those neutrons that escape the detonation with high energies—according to Auxier [89], this means those ‘above the sulfur threshold’, which is at 2.5 MeV—will contribute to the neutron dose at practically important distances. To understand the neutron doses on the ground, we must therefore know the distribution of energy among the neutrons emitted by the detonating bomb, often referred to as the source spectrum. This is a simple enough concept in theory, but it is very difficult to predict in practice. Glasstone [90] explains the reason:
It should be possible, in principle, to calculate the energy spectrum of the neutrons after penetrating the bomb materials. However, since the latter are not completely dispersed when the neutrons are emitted, the neutron spectrum is dependent to a considerable extent on the detailed geometry of the bomb components at an extremely complex stage of the explosion. Because of these and other circumstances, the calculation is virtually impossible and recourse must be had to experiment.
| 6.1.3 |
The T65D dosimetry scheme |
In keeping with Glasstone’s assessment, the development of the T65D dosimetry scheme did indeed involve a lot of experimentation on this and other questions. Ultimately, however, it was impossible to precisely determine the source spectrum of the Hiroshima bomb, since none of the nuclear test detonations performed after the war used a similar bomb design.
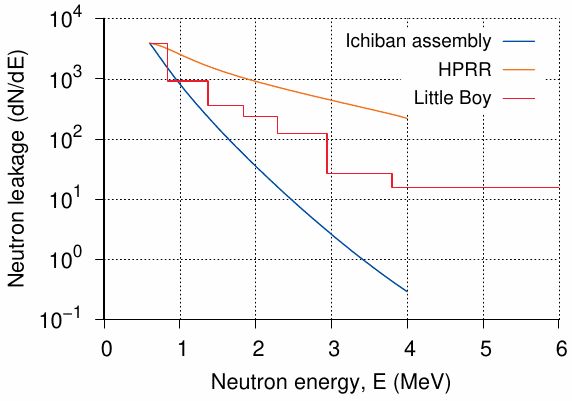
Attenuation of neutrons by the bomb casing has two limiting cases, which can be approximated with two surrogate experiments that were in fact carried out in the studies leading up to T65D [36,91]. The ‘Health Physics Research Reactor’ (HPRR) was a fast neutron 235U reactor with very little shielding; a neutron spectrum similar to this one would be expected if the bomb casing was already completely dispersed before the bulk of the neutrons was emitted. On the other hand, if the bomb casing still remained intact at this crucial instant, then the spectrum would have been much softer and resembled that of the ‘Ichiban assembly’, another test reactor which had a casing similar in strength to that of the Hiroshima bomb.
Figure 6.2 shows the experimental spectra obtained with these two devices. Evidently, the contributions of high-energy neutrons—that is, those neutrons that have any chance at all to reach the ground—are quite different. The T65D scheme had assumed that the neutron source spectrum of the Hiroshima bomb resembled that of the HPRR, or in other words, that the neutrons had escaped the detonation largely unimpeded by the bomb casing. This assumption resulted in the high neutron dose estimates in Hiroshima. In fact, up to approximately 800 m from hypocenter, the T65D physical neutron dose exceeded the γ-dose; and if we factor in a neutron relative biological effect (RBE) of 5 (see Section 2.9.2), then neutron radiation would have dominated the biological radiation effects in Hiroshima among all significantly exposed survivors.
| 6.1.4 |
The DS86 and DS02 dosimetry schemes |
The reign of the neutrons in Hiroshima came to an abrupt end in 1981 with the publication of Loewe and Mendelsohn’s paper entitled “Revised dose estimates at Hiroshima and Nagasaki” [92]. It appeared in the journal Health Physics, which focuses on the biological and medical aspects of radiation. The paper was entirely devoid of physical detail, which was to follow later; the likely reason for such haste is explained in Section 11.5. Meanwhile, the audience was simply advised that
we have prepared new dose estimates which should be considered trustworthy, in part because … the corresponding neutron levels have been shown to agree with in situ activation measurements.
A second paper by the same authors [87] presented some physical arguments; however, these were mostly theoretical in nature, and their presentation lacked the detail a reader would need to decide on their validity for himself. Agreement of calculated neutron doses with in situ 60Co activation measurements that had been reported earlier by Hashizume et al. [81] was claimed, but we will see below that the data then available agree better with T65D. Nevertheless, after some further elaboration, Loewe and Mendelsohn’s revised dose estimates were officially adopted as the DS86 dosimetry scheme in 1987 [93]. The DS02 scheme, which was announced in 2002 [88] and remains in force today, made only fairly minor changes to DS86; for the purposes of this chapter, the two schemes can be treated as equivalent.
Notwithstanding their demand that the new dose estimates “should be considered trustworthy,” Loewe and Mendelsohn were quite aware that these were premature at best. This is readily apparent in the proceedings of a conference on the subject which both Loewe and Mendelsohn attended [89]. Also present was John Auxier, the leading proponent of the T65D dosimetry scheme. The conference took place on September 15th and 16th of 1981, which was one week after Loewe and Mendelsohn had submitted their second paper. At the outset of this conference, Auxier gave an overview of his own very substantial body of work, and he summed up his outlook as follows:
Scientific work either must withstand the hard scrutiny of further work and time or it must be replaced. … The greatest uncertainty in the T65D curves was taken to be the neutron [source] spectrum for Hiroshima [36]. There have been no significant contributions to the study over the intervening years, and we still await a multidimensional hydrodynamic calculation of the spectrum. In the interim it is clear that further work will either substantiate or modify the T65D values, and, until all evaluations are completed, it would appear premature to change our existing perceptions of the dose-response relationships based on the T65D values.
In other words, Auxier stated that thus far nothing of substance had transpired to invalidate the T65D estimates. In the discussion after his talk, neither Loewe nor Mendelsohn spoke up, and none of the other participants who did raise questions challenged Auxier on this statement either.
Loewe himself gave a presentation at the same conference, which is similar in content to his second paper with Mendelsohn [87]. In it, he accounts for their postulated change to the neutron doses as follows:
The difference between our numbers and the previous numbers is due to two factors. One is the assumed lambda of 198 [meters], when it should be 155. … This substantial difference accounts for almost all the difference between our doses and the T65D.
This pointed statement suggests that we can decide between T65D and the more recent dosimetry schemes by considering which of the postulated ‘assumed lambdas’, that is, relaxation lengths, better agrees with measurement. This approach requires that the distance dependency not only of the data but also of the models themselves be well described by a single relaxation length. By using Equation 2.11 to fit dose-distance curves that represent the T65D and the DS86 or DS02 models, we have ascertained that this is the case at distances of up to 1500 m from the hypocenter; beyond this range, there are very few neutron activation measurements anyway. We can therefore use the relaxation length as a yardstick to compare the various neutron fluence measurements and models.
| 6.1.5 |
Energy dependence of relaxation length in T65D and DS02 |
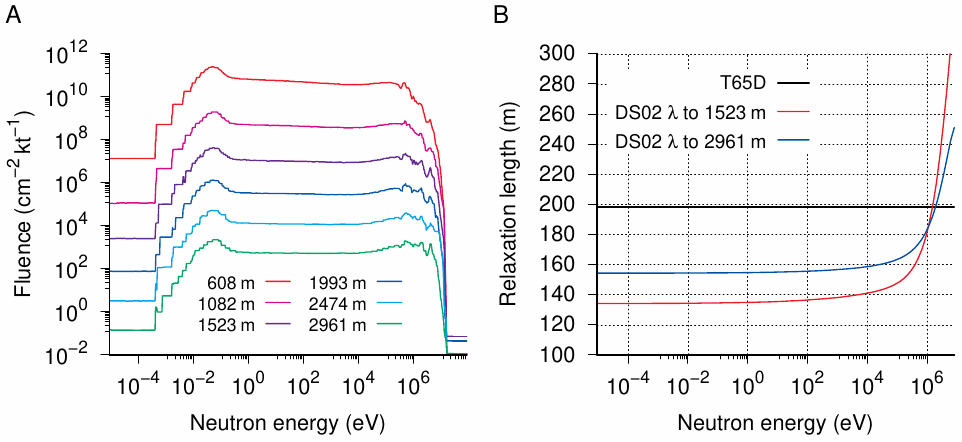
While Loewe summed up his revised dosimetry scheme using a single relaxation length of 155 m, the current DS02 model is better described by treating the relaxation length as energy-dependent: while throughout most of the spectrum the relaxation length is similar to that given already by Loewe, at the high end of the spectrum the relaxation length rises steeply (Figure 6.3B). Such high-energy neutrons cause activation of sulfur to 32P and of copper to 63Ni. If the DS02 scheme were correct, measurements of these two isotopes should accordingly indicate relaxation lengths of somewhat above 200 m, while all other isotopes should indicate relaxation lengths up to 155 m. In contrast, with the T65D scheme, all measurements should yield similar relaxation lengths near 200 m. In the following, we will not try to decide which of the two models is better justified theoretically; instead, we will simply compare each model to the available measurements.
While measurements of isotopes induced by neutron capture have been reported from both cities, we will limit this discussion to Hiroshima, since here there are more data sets, which also generally contain more individual data points. The perception of greater significance, but also uncertainty concerning the neutron doses released in Hiroshima, already spelled out by Wilson [73], most likely caused more experimental effort to be focused on this city. However, as far as can be ascertained from the limited data, the situation in Nagasaki is quite similar with all types of measurements that will be discussed in the remainder of this chapter.
| 6.2 |
Measurements of isotopes induced by low-energy neutrons |
Isotopes in this category include 60Co, 152Eu and 154Eu, 36Cl, and 41Ca. While the precursor nuclides of all of these effectively capture thermal neutrons, they can also capture neutrons of higher energy, with somewhat different efficiencies; these finer distinctions will be considered below. For now, it is important that each of these isotopes should exhibit a relaxation length near 200 m according to T65D, but of at most 155 m according to DS02.
| Neutron energy | Sample type | Samples | λ (m) | Reference |
| slow | 60Co in construction steel | 4 | 183 | [81] |
| 60Co in construction steel | 9 | 220 | [88] | |
| 152Eu in rock and tile | 5 | 203 | [94] | |
| 152Eu in rock and tile | 14 | 184 | [95] | |
| 152Eu in rock and tile | 79 | 173 | [96] | |
| fast | 32P in sulfur from insulators | 18 | 2196 | [88, pp. 645-8] |
The first of these isotopes to be studied was 60Co. Some measurements were carried out already in the 1960s and were cited as evidence in support of the T65D scheme [81].71 Studies on the other isotopes began only after Loewe and Mendelsohn’s initial announcement [92] of the revised dosimetry scheme that ultimately became DS86, but before the publication of the DS02 report (even though some of the data discussed here have been sourced from the latter report [88]). Several of these studies are summarized in Table 6.1.
For the 60Co and 152Eu studies listed in the table, we can calculate an average relaxation length of 192 m. This clearly agrees much better with the T65D value of 198 m than with the value of 155 m that we should expect with the DS02 dosimetry scheme.
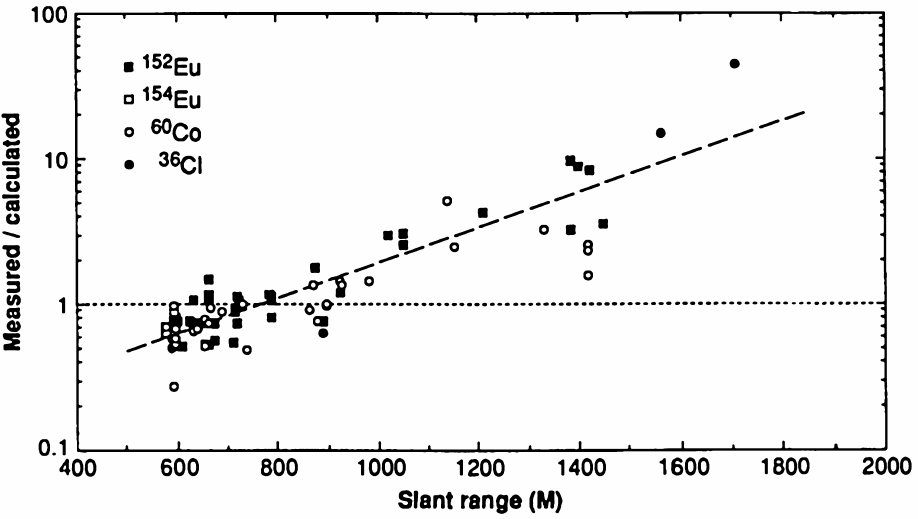
While Table 6.1 does not cover all available 60Co and 152Eu data, similar conclusions can be drawn from several other studies that survey additional measurements using these and other isotopes. In an experimental paper on 36Cl generated by neutron capture in samples of rock and concrete from Hiroshima,72 Straume et al. [98] also gave an overview of ten other, previously published reports, some of which are included here in Table 6.1. When the data from all those studies are combined, the ratio of measured activity to that predicted by DS86 calculations trends systematically upwards with increasing distance from the epicenter (Figure 6.4). The slope of the trend line which Straume et al. drew across their graph corresponds to a relaxation length of 227 meters.73
Thus, overall, the measurements plainly indicate a relaxation length similar to that postulated by the T65D dosimetry scheme. It should be noted that these measurements pertain to three different chemical elements (cobalt, europium, and chlorine). The observed trend therefore cannot be due to the contamination of samples with extrinsic radioactivity, or by the leaching of activity from them, as was claimed at a later time in the case of chlorine (see Section 6.5.1), since such effects should perturb only some elements, but not others.
In light of these findings, it is clear that the abandonment of T65D in favor of DS86/DS02 was a step in the wrong direction. Of course, a much higher relaxation length that is completely out of tune with either dosimetry scheme is obtained from the sulfur activation studies (see Table 6.1). What might be the matter with those measurements?
| 6.3 |
Sulfur activation measurements |
While most radioactive isotopes produced by neutron radiation are formed through the capture of slow neutrons, the activation of sulfur (32S) to radioactive phosphorus (32P) is an exception. This reaction involves not only the capture of a neutron, but also the ejection of a proton, so that the overall number of nucleons remains unchanged. As one might expect, this only works with very energy-rich neutrons; the minimum kinetic energy required is approximately 2.5 MeV. Such ‘fast’ neutrons provide the most direct information on the energy spectrum of the neutrons released by the bomb. They also give a good indication of the fluence to be expected in other segments of the neutron spectrum that contribute significantly to the biological effects of neutron radiation, as do these fast neutrons themselves. Measurements of 32P activity in sulfur samples are thus particularly useful for understanding both the physical and the biological effects of a nuclear detonation. However, unlike isotopes such as 60Co and 152Eu, which have half-lives of several years and therefore can be measured even decades after the event, the half-life of 32P is only 14.3 days, and measurements were therefore possible only in the first few months after the bombing. Thus, one thing that sets the sulfur activation measurements apart from all others is that they were carried out very early on, and moreover exclusively by Japanese research teams.
In Hiroshima, suitable samples were found in the form of porcelain insulators from electric power lines, which contained gram amounts of pure sulfur on the inside.74 Two Japanese teams reportedly performed measurements on such insulators, but the data collected by a group from Kyoto University were ‘lost’ when Sakae Shimizu’s laboratory notebooks were confiscated and ‘mislaid’ (see Section 1.5.5). Therefore, the available measurements are mostly those acquired by the other research team, which was from RIKEN and included the investigators Sugimoto and Yamasaki.
| 6.3.1 |
The shape-shifting raw data |
The earliest mention of the sulfur activation measurements from RIKEN is found in a report by the Manhattan District engineers from 1946 [79, p. 216]. This reference gives locations, distances, and readings in decays per minute (dpm) for exactly nine samples. It is generally assumed that these measurements were obtained using an electroscope, which measures radioactivity cumulatively over time, and which requires calibration with a source of known activity. However, the report also states explicitly that “no additional information concerning these figures was available,” so that it is uncertain whether an electroscope was indeed used, and if so, how it was calibrated and for how long each measurement was carried out. Furthermore, this initial report contains no error estimates for any of the measurements.
The same measurements are described again by Yamasaki and Sugimoto in a short appendix to the official DS86 report [93, p. 246]. The number of samples has increased from 9 to 10. Data are again given in dpm and without error estimates. All samples have migrated with respect to the hypocenter; one sample with high activity is now 300 m nearer to the hypocenter, which notably straightens out the dose-distance relationship. Of note, Yamasaki and Sugimoto state that “from these values, the half-value thickness of the atmosphere against the neutrons was found to be 380 m,” which corresponds to a relaxation length of 548 m.
Although the DS86 report gives no indication of the fact, this appendix is the literal translation of a Japanese report already published in 1953 [100], and it is unclear whether its authors really prepared it themselves for the occasion or even consented to its inclusion in the DS86 report. The doubt arises from another appendix to the same volume, authored by Hamada [93, p. 272], who claims to have worked out the appropriate error estimates for Sugimoto and Yamasaki’s measurements, even though he also states that “the type of Lauritsen electroscope used by Yamasaki and Sugimoto in their sulfur measurements is not yet finally identified.” This indicates that those authors were not available for comment, which in turn suggests that their own contribution to the DS86 report was not recent.75 Surprisingly, Hamada’s appendix tabulates actual electroscope measurement times and readings, rather than counts per minute. The total number of measurements has now increased to 11.76
| Initial report [37] | Later reports [88,93] | |||||
| Sample ID | Weight (g) | Range (m) | Counts/min | Range (m) | Det. Eff. | Spec. Act. |
| 407 | 1.5 | 250 | 35 | 550 | 4.54% | 840 |
| 411 | 2.2 | 350 | 33 | 780 | 3.27% | 741 |
| 510 | 2.6 | 800 | 23 | 980 | 2.80% | 518 |
The same data are revisited by Young and Kerr [88], who manage to increase the number of samples to 14; two of these samples now yield two separate measurements each, for a total of 16 measurements. Samples have again moved with respect to the hypocenter. Furthermore, the authors supplement the RIKEN data with three measurements reported by Sakae Shimizu from Kyoto, which have somehow been recovered from oblivion, notwithstanding the apparently irretrievable loss of his notebooks (see Table 6.2). The stated values for detection efficiency—the ratio of decays counted to those assumed to have occurred—will depend not only on the sample amounts (which differ between the three samples) but also on many other details of the measurement setup. The detection efficiencies in turn will directly affect the estimates of the true specific activities. They were obtained by Monte Carlo simulations; from the information available to him, the reader cannot ascertain whether the claimed uncertainty of the results (15% or less) is realistic.
Considering all of these repeated alterations and ‘corrections’, the question which version of the data should be deemed ‘true’ is of course moot. In the following, we will use the version given in the DS02 report [88], not because we consider it credible, but simply because it is the most recent one.
| 6.3.2 |
Measurements vs. DS02 calculations |
Early on in their report, Young and Kerr claim to have achieved the ‘virtually impossible’ (cf. quotation in Section 6.1.2) by calculating the radiation doses produced by the Hiroshima bomb from first principles [88, p. 16]:
The radiation dose for atomic-bomb survivors is the end product of a series of complex … calculations … The first step in this dose reconstruction process is the calculation of the “source term” for the bombs. These calculations, which were done at the Los Alamos National Laboratory (LANL), simulate the explosion of the bombs … Additional radiation transport calculations are required to evolve these initial distributions from the epicenter of the explosion through the air to the ground.
We will not attempt to judge the soundness of these calculations as such, but rather focus on comparing them to experiment. To this end, we first note that Young and Kerr’s calculated neutron dose-distance curve can be reproduced almost perfectly using the following empirical formula:
| \( A \) | = | \( \alpha \times e^{-\frac{s-H\mathstrut}{L^{\mathstrut}}} \) | (6.1) |
In this equation, A is the activity expected in this sample; e is Euler’s number (2.7183); s is the slant distance, that is, the direct distance in meters of the sample from the epicenter; H is the height of the epicenter above ground; L is a length constant; and α is the activity expected at the hypocenter, since at this point s−H=0. For a sample at some ground distance g from the hypocenter, the corresponding slant distance s is given by Pythagoras’ theorem:
| \( g^2 + H^2 = s^2 \) | ⇐⇒ | \( s = \sqrt{\,g^2 + H^2} \) | (6.2) |
According to Young and Kerr [88], the height of the epicenter above ground is 600 m,77 and a fairly good fit of Equation 6.1 to DS02 calculations is indeed obtained when we use this value for H, together with values of 2350 dpm for α and 160 m for L. However, an even better fit results if we simply let a numerical fitting algorithm78 pick the best values for all three parameters. The result of this procedure is shown in Figure 6.5.
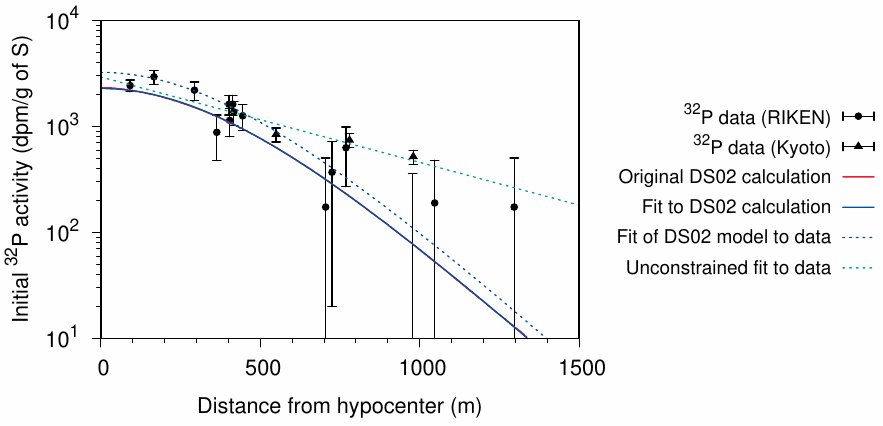
| Fitted parameter values | |||
| Curve | α (dpm) | H (m) | L (m) |
| Fit do DS02 calculation | 2278 | 681.9 | 151.25 |
| Fit of DS02 model to data | 3233 | 681.9 | 151.25 |
| Unconstrained fit to data | 2929 | 0.1 | 539 |
Evidently, our simple equation approximates the DS02 calculation very closely. We can therefore substitute it for the latter in doing our own data analysis. In particular, we can ask whether or not the DS02 calculation given by Young and Kerr [88] is correctly scaled to best fit the measurements. For this purpose, we will keep the shape of the model, which is defined by its H and L parameters, and vary only the pre-exponential scaling factor α so as to best fit the measured sulfur activities. It turns out that this gives an α value of 3233 dpm, which is 42% higher than the one which matches the graph of the DS02 calculation in the report (2278 dpm). What should we make of this finding?
Overall, the sulfur activity on the ground should be proportional to the total neutron fluence, which in turn should be proportional to the ‘bomb yield’, that is, the energy released in the explosion, conventionally stated in kilotons TNT equivalent. Thus, the most straightforward explanation is that the bomb yield is 42% higher than assumed in the DS02 calculation. That number is 16 kt; if we increase it by 42%, we obtain 22.7 kt. However, Young and Kerr claim that the measurements indicate 18±2 kt as the most likely bomb yield, which they take as confirmation of their calculated value of 16 kt. To accomplish this feat, they employ two tricks:
- They stipulate that the bomb at the moment of the detonation was tilted against the vertical. Since the bomb had a longitudinal shape with thicker casing at both ends, the assumed tilt caused the neutron fluence on the ground to not be rotationally symmetric. By carefully choosing the angle (15°) and orientation of the tilt, they narrow the gap between calculation and measurement, which according to our analysis is 42%, by about 10%.
- On page 656 of their report [88], they state that “the sulfur activation measurements of the Riken survey team can be used to make an estimate of the energy yield for the Hiroshima bomb … The sulfur-activation measurements by the Kyoto survey team were not used … because of the large uncertainties in the ground distances at which the sulfur samples were collected.” As can be seen in Figure 6.5, these latter values trend higher than the ones from RIKEN, and they also have much smaller error bars; thus, their exclusion will significantly lower the weighted average of the sulfur measurements.
The pretext for omitting the Kyoto data is of course not credible—surely the technicians or scientists who collected those samples would have carefully recorded the location of each, and from these the ground distances to the hypocenter could be unambiguously determined. This omission simply amounts to cherry-picking of the evidence, which in real science would be inadmissible.
In the above analysis, we only changed the scale of our DS02-equivalent model, but left its shape unchanged. If we allow the fitting algorithm to adjust all three parameters to best match the measured data, the shape of the resulting curve changes completely. Remarkably, the H parameter vanishes entirely (see table in Figure 6.5), which means that the epicenter drops to the ground and merges with the hypocenter, and the 32P activity becomes a direct exponential function of the distance from this unified center. Thus, if allowed to speak freely, the data flatly reject the DS02 model. Furthermore, while the model that results from our unconstrained fit is even simpler than the one we started with, it is also completely devoid of physical plausibility. If the data agree best with a non-physical model, this suggests of course that they were fabricated.
| 6.3.3 |
Burst altitudes and relaxation lengths |
We noted above that the DS02 report had raised the burst altitude of the Hiroshima bomb from the previous value of 580 m to 600 m. Its authors justify this as follows [88, p. 29]:
Both sets of fast neutron measurements support the elevation of the Hiroshima height of burst to 600 m and the yield to 16 kt.
The second set of fast neutron measurements referred to in the quote concerns the formation of 63Ni (nickel) in metallic copper, which will be considered in Section 6.5.2; for now, we will stay with the sulfur studies.
Considering the pronounced scatter in the sulfur activation measurements and their very large assumed errors, the claim that such data can serve to define the height of the detonation to within 20 m should raise some eyebrows. To evaluate it more rigorously, we will once more resort to the estimation of relaxation lengths. In Figure 6.6A, the same measurements as in Figure 6.5 have been plotted according to Equation 2.11; following the DS02 report, a detonation height of 600 m has been assumed. In this plot format, the variation in the magnitude of the error estimates assumes grotesque proportions, and accordingly the use or omission of these assumed errors in the fit has a major effect on the result. If we do use the errors, we obtain a λ of 2196 m, as already stated in Table 6.1 above; if we omit them, the result is 508 m. While this number is at least in the triple digits, it is still twice higher than the value of 241 m, which is the best approximation to the official DS02 calculation.
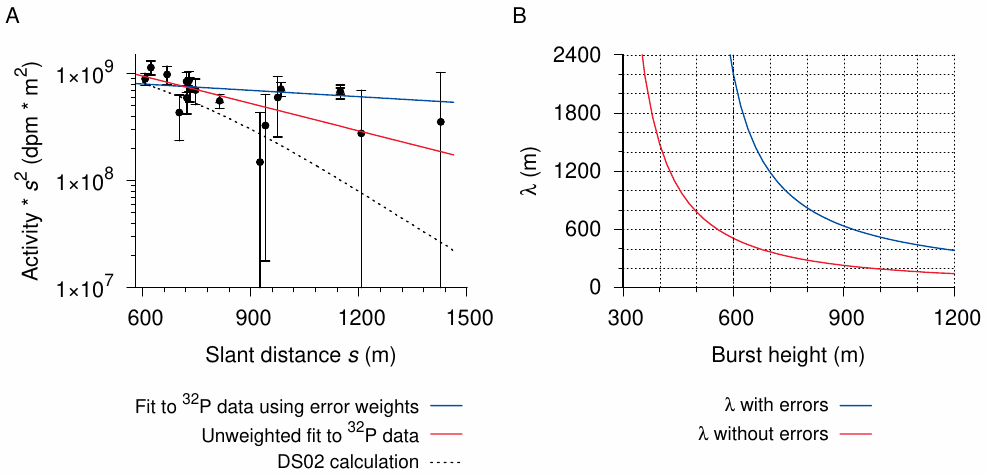
In Figure 6.6B, the assumed height of the detonation has been varied systematically, and for each value the best fit of the relaxation length has been determined. We see that λ decreases with increasing burst height, but realistic values—below, say, 300 m—are attained only at a burst height of 800 m when fitting without measurement errors, or more than 1200 m when using them. Clearly, extorting realistic relaxation lengths and burst heights at the same time from the data is a lost cause.
It will be evident from the above that the use or omission of estimated measurement errors in the analysis is ultimately inconsequential, since either way the results are physically implausible and contradict the claims made in the DS02 report. Nevertheless, considering how strongly these errors affect the outcome of the numerical fits, it should be emphasized again that neither the original report on the RIKEN measurements [79, p. 216] nor that on the Kyoto data [37] actually contain any error estimates. These were divined only at later points in time; and I have not found any justification for the very different magnitude of estimated errors assigned to the data from RIKEN and Kyoto, respectively.
| 6.3.4 |
Appraisal of the sulfur activation data |
Both Figure 6.5 and Figure 6.6A make it plain that 32P levels in samples taken at distance from the hypocenter at Hiroshima are far too high relative to samples taken near it. This clearly rules out the simultaneous activation in situ of all samples by a single nuclear detonation; they could not have turned out this way even if an atomic bomb had gone off at the purported time and place. These data must therefore be considered fabrications.
| 6.4 |
Comparative cobalt and europium activation studies |
In Section 6.2, we already encountered some studies on the activation of these two elements by capture of low-energy neutrons. The predominant stable isotope of cobalt is 59Co, which is converted to 60Co by neutron capture. In contrast, europium contains two stable isotopes in almost equal abundance, 151Eu and 153Eu, which are activated to 152Eu and 154Eu, respectively. The three radioactive isotopes differ in half-life, and the three precursors differ with respect to the efficiency of capture of thermal and epithermal neutrons, respectively; the latter ones have kinetic energies exceeding that which remains after thermal equilibration with the surrounding atoms and molecules. Because of these differences, comparing the activities of all three isotopes within the same samples can provide some interesting insights.
| 6.4.1 |
Comparing isotopes to estimate the date of activation |
Nakanishi et al. [94] examined rock samples and roof tiles from Hiroshima to determine the total amount (‘fluence’) of neutron radiation from the bomb. While most samples were analyzed for 152Eu only, the investigators did measure the activities of 60Co and of 154Eu as well on one sample, and they derive estimates of the neutron fluence separately for each isotope. These estimates, together with the half-lives, are listed in Table 6.3.79 In principle, all three estimates should coincide, but we notice some divergence: the estimated fluence decreases from 60Co on the left to 152Eu on the right. We also note that the half-life changes in the reverse order. Could these two observations be related?
The neutron fluence is calculated from the activity of each isotope at the time of activation, which is presumably the bombing. This value is obtained by correcting a recent measurement for the decay since the time of activation. Since each isotope has its own characteristic half-life, these correction factors will be different, and more importantly the ratios between these factors will vary with time. If we assume too early a date of activation, then all our fluence estimates will be inflated, but those inferred from isotopes with shorter half-lives will be inflated more. Conversely, if we assume too recent a date of activation, then all activities will be underestimated, but those of shorter-lived isotopes will be deflated more. As evident in Table 6.3, the shorter-lived isotopes yield the higher estimates in Nakanishi’s study, suggesting that these samples underwent neutron activation only sometime after the bombing.
| Isotope | 60Co | 154Eu | 152Eu |
| Fluence (1012 cm-2) | 7.9 ± 0.8 | 6.4 ± 1.4 | 6.01 ± 0.42 |
| Half-life (years) | 5.2719 ± 0.0011 | 8.5 ± 0.5 | 13.2 ± 0.3 |
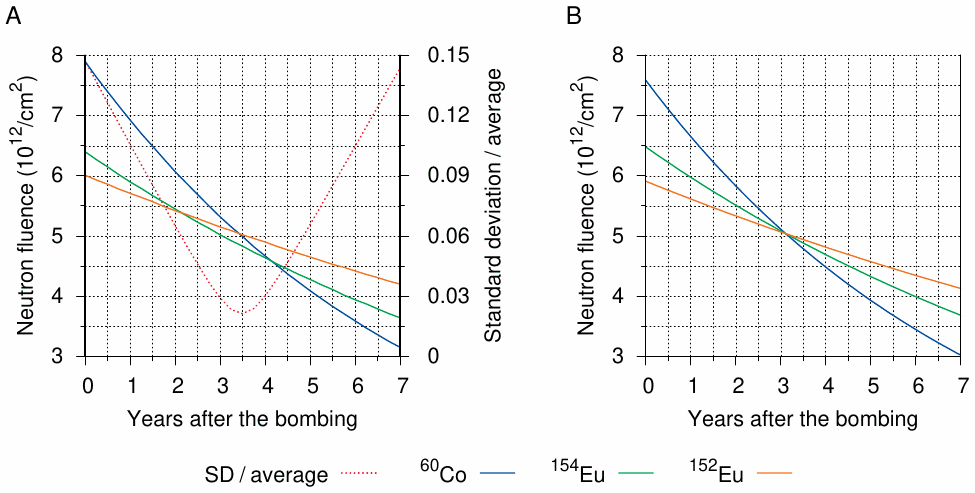
To find the most likely date of activation, we can project Nakanishi’s fluence estimates forward and look for the point in time at which agreement between all three curves is best. This has been done in Figure 6.7A. The curve for each isotope starts with Nakanishi’s fluence estimate at the time of the bombing for the respective isotope. The other points on each curve represent the fluence estimates that will result if the assumed date of neutron exposure is changed, but all else is kept constant. All intersections between any two of the three curves occur at or near 3.5 years after the bombing. This is also the point at which the ratio of the standard deviation of all three values to their average attains its minimum. Thus, Nakanishi’s fluence estimates suggest that the sample was exposed to neutrons not in August 1945, but approximately 3.5 years thereafter.
| 6.4.2 |
Activation by thermal vs. epithermal neutrons |
In their initial paper [94], Nakanishi et al. do not spell out exactly how they converted their measurements of isotope activity to estimates of neutron fluence. They do, however, give more detail in a subsequent study that is included as Appendix 5/14 in the official DS86 report [93, p. 310 ff]. The measurements described in this second document pertain to the same three isotopes but to a separate set of samples. The authors assume that not only thermal neutrons may have contributed to the activation, but also epithermal ones, and they estimate the respective contributions of each by comparing the three isotopes’ activities.
A little more background is required to understand how this calculation works. Each isotope differs from the two others in its propensity to capture thermal neutrons, which is described by its thermal cross section, and also to capture epithermal ones, for which the authors provide a resonance integral (Table 6.4).80 The ratio of these two parameters is again different with each isotope; with 152Eu, the thermal cross section exceeds the resonance integral, whereas the reverse is true of the other two isotopes. Therefore, at a given total neutron fluence, a high contribution of epithermal neutrons will boost the activities of 60Co and particularly of 154Eu, whereas exposure to thermal neutrons only will favor formation of 152Eu. It follows that we must also get the contributions of thermal and epithermal neutrons right in order to satisfy the requirement that all fluence estimates coincide at the time of activation.
| Isotope | Eu-152 | Eu-154 | Co-60 |
| Activity measured (Bq/kg of sample) | 28.2 | 1.32 | 4.22 |
| Element content (mg/kg of sample) | 1.38 | 1.38 | 23 |
| Half-life (years) | 13.537 | 8.593 | 5.2714 |
| Thermal cross section (10-24 cm2) | 5,900 | 320 | 37.2 |
| Resonance integral (10-24 cm2) | 3,700 | 1,635 | 75.5 |
| Precursor isotope | |||
| Abundance (fraction) | 0.479 | 0.521 | 1 |
| Bulk atomic weight | 152 | 152 | 59 |
| Years since bombing: 32.107 | |||
| Epithermal neutron fraction: 4.02% | |||
| Neutron fluence at time of bombing (1012 cm-2) | 5.910 | 6.479 | 7.589 |
With two isotopes only, we could only determine one unknown parameter, which means we would need to fix either the time of activation or the fraction of epithermal neutrons. However, with a third isotope available, we can numerically fit the fractional contribution of epithermal neutrons that makes the three fluence estimates the most similar at any point in time; and the result should indicate the most likely date of activation. With Nakanishi’s initial sample, it turns out that this is slightly above 3 years after the detonation (Figure 6.7B). Moreover, the epithermal fraction that produces this agreement is rather low (4%). The resulting fluence estimates for the individual isotopes are close to those given in the original study, suggesting that Nakanishi et al. [94] had determined a similarly low contribution of epithermal neutrons. In fact, if we instruct the fitting algorithm explicitly to match Nakanishi’s fluence estimates as closely as possible, it returns an epithermal fraction of 5%.
The second study by Nakanishi et al. [93, pp. 310-9] measured all three isotopes on two samples. If we apply the same analysis to those samples, the results are quite different: the time of activation is within 0.5 years of the bombing, and the epithermal neutron fraction is greater than 20%. The latter number agrees with a graphical analysis contained in the original report.
Another study that we may draw into this comparison is one by Rühm et al. [97], who examined the abundance of all three isotopes, as well as two additional ones (36Cl and 41Ca), in a tombstone from a graveyard near the hypocenter. They conclude that the soft neutron spectrum assumed by DS86 cannot explain the collective findings. They test various hypothetical neutron spectra, all of which are ‘harder’ than the one assumed by DS86. They obtain the best fit to their collective data with no thermal neutrons at all—or, rather, with a negative contribution of thermal neutrons, which is of course physically impossible. We therefore can take 100% as their best estimate of the epithermal neutron contribution. It is noteworthy that both 36Cl and 41Ca are rather long-lived isotopes;81 thus, their abundance would not be affected by any inaccuracies in the date of activation. The observed deviations from expected values—36Cl was found lower, and 41Ca higher than expected based on DS86—can therefore be ascribed unambiguously to the neutron energy spectrum.
The findings from all three studies are compared in Table 6.5. Evidently, once more nothing really fits together. All samples were collected at or near the hypocenter and should have been exposed to the same neutron energies, or at least similar ones—yet, the contribution of epithermal neutrons varies from almost nothing (4%) to 100%. Nor does the sample composition explain this variation—neither the two roof tiles nor the two granite samples resemble each other. The most similar results are obtained with the two samples characterized in Nakanishi’s second study, even though they are of different composition and come from different locations. In summary, both the very wide spread of the epithermal neutron fraction and the delayed activation of the single sample from Nakanishi’s first study [94] indicate that these four samples were not activated by the same neutron source at the same time.
| Sample | Epithermal neutrons (%) | Activated at (y) | Ref. |
| Roof tile (Shima hospital) | 4 | +3.125 | [94] |
| Roof tile (Shima hospital) | 21 | −0.25 | [93] |
| Granite (Motoyasu bridge) | 26 | +0.5 | [93] |
| Granite (tombstone) | 100 | n/a | [97] |
| 6.5 |
New and improved measurements: everything finally falls into place |
The discrepancy documented in Section 6.2 between DS86 calculations and the observed range of neutrons was cause for considerable puzzlement, and throughout the 1990s much ink was spilled on attempts to reconcile the recalcitrant data to the officially sanctioned theory, all ultimately unsuccessful.82 It was clear, therefore, that one had to give way. In regular science, that would of course have been the theory; for, as famous physicist and Manhattan Project participant Richard Feynman so pithily explained, “if it disagrees with experiment, it’s wrong.” However, as should by now be clear, we are not dealing here with pedestrian, workaday science—something greater and more precious than mere scientific truth was at stake, and therefore the experimental data had to relent. Accordingly, new and improved data were presented in the experimental chapters of the DS02 report [88].
| 6.5.1 |
Revised thermal neutron measurements |
Isotopes induced mostly by thermal neutrons include 36Cl, 60Co, and 152Eu. With all of these, a systematic deviation from DS86 had originally been observed; the data agreed closely with T65D instead (see Section 6.2), even though this was not explicitly acknowledged in the corresponding literature. To prop up the revised dosimetry schemes, more compliant data were therefore needed. The earlier measurements on 36Cl were disavowed in the DS02 report and declared tainted by surface contamination. However, the amount of 36Cl attributed to ‘background’ with new samples in the revised study [88, p. 502] (36Cl/Cl 1.24× 10⁻¹³) is almost identical to that which had already been interpreted as background in the original one [98], so that it remains unclear exactly why those earlier data should now be considered invalid. In fact, the DS02 report simply supplants the earlier measurements, which had been performed on concrete samples, with new ones obtained on granite, for which it claims close agreement of distance-dependent neutron fluence with DS02 calculations. Similarly, for 60Co, some new data sets are rounded up that display better agreement with DS02 calculations than earlier measurements, but no clear explanation is offered for the difference between these new results [88, p. 456 ff] and the old ones.
While some of the authors of the original report on 36Cl [98] readily cooperated in the disavowal of their own previous results, the researchers who had contributed most of the earlier 152Eu data, Nakinishi and Shizuma [95,96], were not so obliging but asserted that their original measurements had been accurate and were reproducible [88, p. 482 ff]. It therefore became necessary to throw them under the bus. To do so, several samples, purportedly a subset of those measured earlier by Shizuma et al. [96], were sent out to four different laboratories, which proceeded to measure them again. The new results agree closely with DS02 calculations. The discrepancy is tentatively ascribed to a failure of the earlier study [96] to properly account for background; however, a close reading of that study shows that background and limits of detection sensitivity had been given the required attention. Shizuma et al. were, of course, excluded from this splendid effort, which was described in the DS02 report [88, p. 578ff] and also in a separate publication [102]. As far as the reader is concerned, this is a case of one person’s word against another’s, which to adjudicate he lacks the means.
In summary, the DS02 report introduces new measurements of thermal neutron activation that agree with its own calculations of distance-dependent neutron fluence. With all three isotopes—36Cl, 60Co, and 152Eu—the calculations are well approximated using Equation 2.11 with a relaxation length of 136 m, which agrees with the analysis in Figure 6.3 (cf. the red curve in panel B). No substantial explanation is given as to why earlier measurements for all of these isotopes had agreed with T65D rather than with DS02. Moreover, all of the new data introduced in DS02 pertain to single isotopes only; there are no simultaneous measurements of multiple isotopes on the same samples, which, while being more informative, are more apt to reveal embarrassing problems and inconsistencies.
| 6.5.2 |
New measurements of fast neutrons |
An interesting development documented in the DS02 report is the detection by mass spectrometry of a long-lived nickel isotope, 63Ni, which is formed from copper (63Cu) by capture of a fast neutron and concomitant ejection of a proton. The only other isotope to detect fast neutrons measured thus far had been 32P induced in sulfur, which is very short-lived (see Section 6.3); therefore, the advent of this method marked a major technical breakthrough.
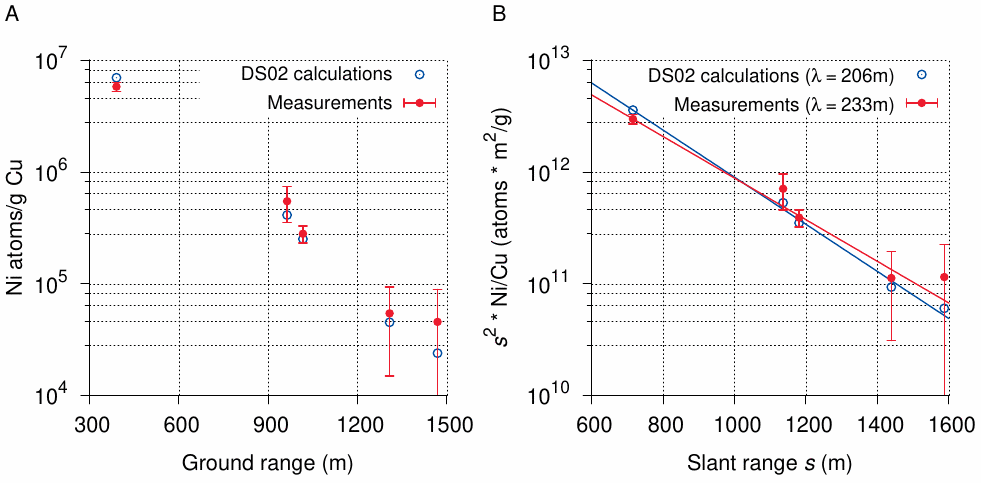
Samples of metallic copper from five different sites in Hiroshima were recovered. All samples are said to have been in a direct line of sight to the detonation and should therefore give us an accurate picture of distance-dependent neutron fluence, undistorted by variations of radiation shielding between samples. As Figure 6.8 shows, the five samples, which span a considerable range of distance from the hypocenter, indeed follow a fairly regular trend. We notice, however, that the experimental relaxation length is somewhat higher than the calculated value. We can make both equal by increasing the height of the detonation from 600 m to 692 m (with concomitant changes to the assumed bomb yield also). While this result is certainly in better agreement with the official story than the numbers inferred from the sulfur activation data (see Section 6.3), it hardly supports the decision taken in the DS02 report to anoint 600 m as the ‘true’ height of the detonation.
| 6.6 |
The generational model of fakery |
While the reader might at this point feel understandably bewildered by the many incongruent findings presented in this chapter, we maintain that these do in fact follow a recognizable pattern. To show this, we will divide the evidence into three generations.
| 6.6.1 |
Evidence faked very shortly after the bombings |
Most important in this generation are the sulfur activation measurements discussed in Section 6.3. When tasked with producing these data, the experimenters most likely did not have the benefit of an elaborate, accepted theory that would fix the location of the epicenter, the source spectrum of the neutrons, and their attenuation by the atmosphere. Thus, they lacked the necessary guidance in selecting the proper parameters while exposing their fake samples to neutron radiation in the laboratory. Despite their best intentions, therefore, they produced flawed data that even after numerous ‘corrections’ and the contrivance of very large measurement errors fit neither the T65D nor the DS02 dosimetry scheme.
We noted in Section 6.3.1 that Yamasaki and Sugimoto’s report on sulfur activation had originally been published in Japanese in 1953 [100]. The same volume contains another report by the same authors on measurements of 32P in human bones [103]. While the measured isotope is the same in both cases, within bones it is produced from 31P through a straightforward capture of a thermal neutron. For these measurements, the authors obtain a half-thickness of atmospheric attenuation of 90 m, corresponding to a relaxation length of 130 m. Considering that these are apparently the only data that both precede and support the DS86 and DS02 reports, it is rather peculiar that neither report includes them. Most likely, the authors of both reports felt unequal to the task of explaining away the discrepancy between a relaxation length of 548 m for fast neutrons (32P in sulfur, see Section 6.3.1) but only 130 m for thermal neutrons, as determined by the same investigators, using the same methods and equipment; and they therefore once more resorted to cherry-picking the evidence.
| 6.6.2 |
Evidence faked with the benefit of early dosimetry models |
It is difficult to say when exactly the samples for these measurements were produced, but the findings discussed in Section 6.4.1 suggest that at least some of this was going on as early as three years after the war. By this time, it should have been possible to develop a frame of reference that would include estimates of the bomb yield, location of the epicenter, and range of neutron transport through the air. The pronounced variation in the neutron energy spectrum that is evident from Table 6.5 suggests that this aspect had not been sorted out. Alternatively, it could be that the possible study of more than one isotope in the same sample was not anticipated when these samples were fabricated. Measurements of single isotopes on each sample only—a practice restored to prominence in the DS02 report, notwithstanding greatly increased analytical capabilities—could not have detected anything amiss with the neutron spectrum or with the date of activation. In this case, there would have been no need to match the neutron spectra of the laboratory sources to each other or to that of the imaginary bomb.
As we had seen in Section 6.2, the relaxation lengths inferred from the various measurements of this period are in reasonable agreement with the T65D dosimetry model. It may well be that a considerable amount of evidence supporting T65D was generated, and that the so-called ‘DS86 neutron discrepancy’ arose simply from the continued use of this stockpiled evidence after the introduction of the DS86 scheme.
| 6.6.3 |
Evidence faked to prop up the current low neutron dose estimates |
The measurements which support the current estimates are limited in number and scope, but they appear to match both the low- and the high-energy part of the neutron spectrum (cf. Figure 6.3). Their very belated appearance in the literature—the ‘DS86 neutron discrepancy’ was allowed to fester for more than a decade, without any contrary evidence being presented—suggests that these samples were prepared only a short time before the publication of the DS02 report [88].
| 6.7 |
Conclusion |
This chapter has shown that the evidence of neutron radiation cannot withstand close scrutiny; incongruent findings and questionable data manipulations abound. In this regard, it resembles the previously discussed evidence of nuclear fallout and of γ-radiation. Thus, no firm ground exists anywhere in the entire arena of physical studies adduced to prove that the nuclear detonations really happened. With this in mind, we will now turn our attention to the medical side of the evidence.