| 5 |
γ-Ray dosimetry by thermoluminescence |
This chapter looks at two studies that purport to have measured the γ-radiation released by two atomic bombs. The measurements utilized the thermoluminescence of ceramic materials which allegedly had been exposed to the bomb radiation. While one of the two studies evades specific criticism by presenting only conclusions but no actual measurements, the experimental detail contained in the other study proves it to be fraudulent.
When a fission bomb detonates in the air, radiation will propagate radially in all directions from the epicenter, i.e. the site of the detonation. Of all places on the ground, the hypocenter, that is, the spot vertically underneath the epicenter, will receive the highest dosage of radiation. With increasing distance from the hypocenter, the dosage will decrease rapidly; and at any given distance, it may be reduced through shielding by concrete buildings or other structures.
Both γ-rays and neutrons can in principle be monitored promptly with suitable detectors [36], and the means were already available in 1945. When such direct readings are lacking, as is the case in Hiroshima and Nagasaki, one can still try to determine in hindsight how much neutron and γ-radiation was released in the burst. For γ-rays, this can be done through thermoluminescence measurements on suitable rocks or ceramics that were exposed during the blast; the neutron radiation can be quantified from induced radioactivity. Measurements of this kind are indeed the showpieces among the evidence advanced to prop up the official story; and taken at face value, their findings leave no other conclusion than that some sort of nuclear detonation must indeed have taken place. We will consider both methods and their applications in turn. In this chapter, we will examine two early studies which used thermoluminescence measurements on bricks or tiles to determine the γ-dosages that were released in Hiroshima and Nagasaki [80,81]. The procedures used by both studies are similar in principle, but they show surprising differences in detail that highlight significant pitfalls of each study (see Table 5.1).
| 5.1 |
Calibration of thermoluminescence measurements |
As explained in a little more detail in Section 2.8.3, the method involves the observation of light given off by ceramic materials when these are heated up gradually; the intensity of the light thus evoked is proportional to the cumulative amount of γ-radiation which this material was exposed to earlier, and potentially a very long time ago.
A crucial step in this procedure is to establish the relation between the activating γ-ray dose and the resulting thermoluminescence intensity. This relation will be affected by the chemical composition of a particular piece of ceramic, and therefore the measurement must be calibrated empirically for each sample. To this end, both studies use the same clever trick: they first heat the brick or tile in question to obtain an uncalibrated measurement of the thermoluminescence originating from the bomb. This heating run will purge the material of all pent-up thermoluminescence. The deactivated material is then recharged by irradiating it with a known dose of γ-radiation from a laboratory source. From the amount of light released when the sample is heated again, the dose-response ratio can be determined. This value can then be used to calculate the γ-dose that would have caused the thermoluminescence signal which was measured first.
| Study | Higashimura et al. [80] | Hashizume et al. [81] |
| Use of roof tiles from wooden buildings | suitable and used as samples | not usable, since orientation relative to hypocenter unknown |
| Calibration | irradiation with 60Co | combination of X-rays with γ-rays from 60Co and 137Cs |
| Glow curve shape | bomb and calibration samples are different | bomb and calibration samples are similar |
| Thermoluminescence signal at 180∘C | not detectable in bomb-exposed tiles | detectable with lifetime of 6.7 × 10⁵ years, used exclusively |
| Thermoluminescence signal at 330∘C | detectable with lifetime of 100 years, used exclusively | not used |
| Loss of signal due to fire | considered, said to be avoided by sample selection | not mentioned |
| Loss of signal due to bomb flash | not mentioned | not mentioned |
| Depth distribution of signal in sample | not mentioned | determined only on a single calibration sample |
Unless proven otherwise, one must assume that the efficiency of activation may vary with the energy of the impinging γ-particles. To account for this, Hashizume et al. [81] employ a combination of various sources claimed to match the energy spectrum the bomb radiation.61 In contrast, Higashimura et al. [80] employ only a single 60Co source.
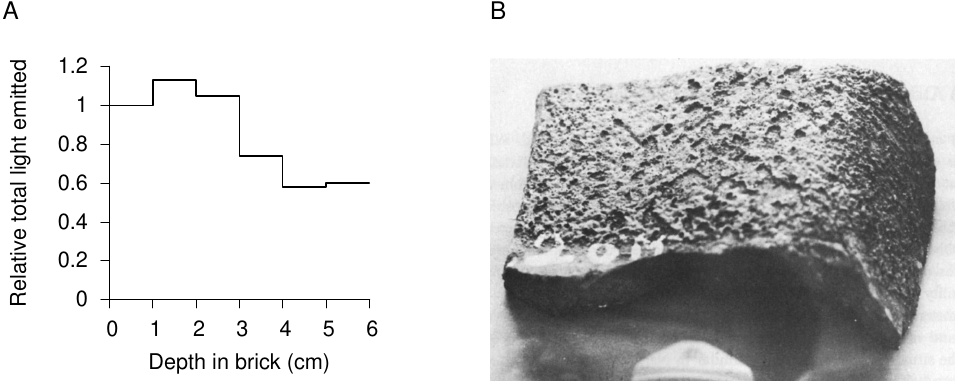
Taken at face value, the calibration procedure which Hashizume et al. [81] adopted would seem superior. There is, however, serious cause to doubt their assertions. In one of their experiments, the authors sliced up a brick into layers of 1 cm thickness to determine the depth distribution of thermoluminescence.62 The result is reproduced here in Figure 5.2A. Now, this depth distribution would depend on the energy spectrum of the activating γ-radiation, since softer (i.e. lower-energy) radiation would exhaust itself closer to the surface, while harder rays would penetrate and cause activation in deeper layers also. Thus, this experiment would be a good way to validate the authors’ assumptions about the bomb energy spectrum, and furthermore to observe changes to this spectrum with increasing distance from the hypocenter. It is very strange, therefore, that this experiment was carried out only once, and only on an experimentally irradiated sample, but never on a native one. This is just one of several issues that raise the question how this entire study could possibly have survived serious peer review.
| 5.2 |
Signal shape and stability |
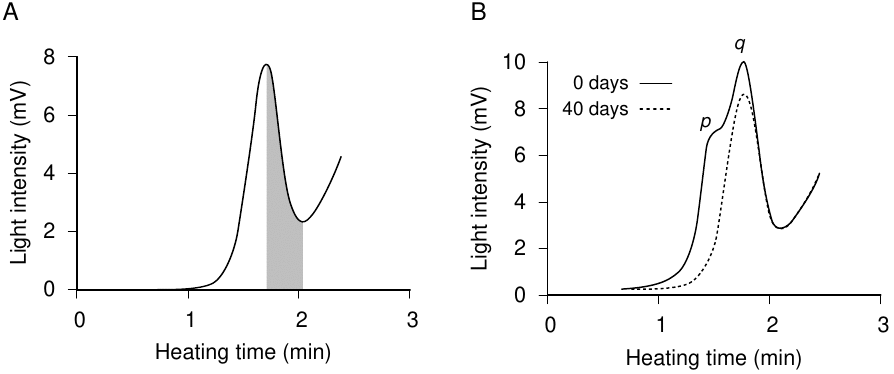
Another flaw in the study by Hashizume is the failure to clearly identify any of the few glow curves they show as that of a native sample rather than of a calibration run.63 The authors do suggest that native and calibration signals are similar in shape, but they never prove it. The signal shown in their Figure 6 (reproduced here as Figure 5.1A) is referred to as “a typical glow curve from a sample,” which is suggestive yet remains ambiguous; all other data shown are described as originating from laboratory activation. Showing some native and calibration runs side by side would have greatly helped their case, and it is difficult to imagine that none of our fearless yet imaginary peer reviewers would have demanded it.
Another questionable feature is the assumed stability of the thermoluminescence signal in Hashizume’s selected temperature range. While the x axes in Figure 5.1 are labeled in units of time, the rate of heating to the final temperature of 300∘C at 3 min would have been fairly linear, and the two overlapping peaks in panel B would be located at approximately 140∘C and 180∘C, respectively. The temperature at which a given luminescence peak occurs correlates with the activation energy, that is, the height of the energy threshold that the trapped electrons in the sample must overcome in order to return to what is ultimately a lower state of energy. This also translates into different stability under ambient conditions; the lower the trigger temperature, the more readily the peak will fade over time even without any heating of the sample.
Hashizume et al. [81] report that their lower-temperature peak (labeled with p in the figure) disappears spontaneously (without heating) within 40 days of experimental irradiation, but claim that the other one (peak q) should be stable with a lifetime of 6.7 × 10⁵ years.64 Accordingly, they use the right half of this peak to quantify the radiation dose in all their samples (cf. Figure 5.1A). However, such an enormous difference in lifetime for peaks that are separated by only some 40∘C seems unlikely. Indeed, a very different assessment is given by Higashimura et al. [80], who report that in their bomb-irradiated samples no peak at 180∘C is observed, although it does occur after experimental irradiation with 60Co:
Glow curves resulting from bomb radiation in the past and from the 60Co irradiation in the present are different in shape. The glow curve resulting from 60Co irradiation shows … a distinct peak at about 180∘C. On the contrary, the glow curve resulting from bomb radiation has a negligible intensity below 180∘C.
Accordingly, they discard the peak at 180∘C altogether and instead evaluate only the signal evoked at a much higher temperature range (≥ 330∘C), for which they nevertheless much more cautiously claim a lifetime of “longer than 100 years.” In summary, between the failure to present the evidence that any of their own bomb-exposed samples exhibit this peak, and the starkly contrasting observations from the earlier study [80], the findings reported by Hashizume et al. [81] cannot be trusted.
| 5.3 |
Sample inactivation by heat from the bomb and the fire |
If bricks and tiles were to be used for retrospective evaluation of thermoluminescence, it was essential that they be kept at gentle temperatures throughout, from the moment of their activation by the γ-rays from the blast to the laboratory measurement. Premature thermal inactivation could have occurred due to heat either from the bomb itself, or from the subsequent fires. Higashimura et al. [80] state that they used roof tiles which came from areas unaffected by the fire. However, such areas must have been very hard to find. In their book chapter on the extent of the fires in Hiroshima that followed the bomb attack, Kawano et al. [82] state:
Within 30 minutes after the bomb blast, large fires broke out and firestorms started. … As a result of the firestorms, anything that was burnable was completely destroyed in an approximately 2 km radius from the hypocenter.
‘Anything burnable’ should certainly include the wooden buildings whose roof tiles were used for Higashimura’s study; all of their samples are said to have been collected within 1 km of the hypocenter.65 Indeed, Hashizume et al. [81] forgo those roof tiles altogether. Ostensibly, however, this is not because of the direct effect of the fire, which they avoid to discuss altogether, but for a more fastidious reason: since all those wooden houses had been ‘destroyed,’ it was no longer possible to tell how the roof tile in question had been oriented relative to the impinging γ-rays. This unknown angle would have affected the absorbed dose and thus have been a source of significant yet unaccountable variation. To circumvent this problem, they restrict themselves to flat tiles and bricks from concrete buildings that had been left standing after the attack, and for which the orientation toward the center of the detonation was therefore known. They also emphasize that all their samples had been in a direct line of sight to the center of the detonation, and therefore received an unshielded dose of γ-rays.
How does Hashizume’s choice of samples affect the question of thermal inactivation? While many large buildings were left standing after the attack, they nevertheless were also affected by the fire. In the evening of August 8th, that is, two and a half days after the bombing, the physician Michihiko Hachiya noted in his diary [62]:
Concrete buildings near the center of the city, still afire on the inside, made eerie silhouettes against the night sky. The glowing ruins and the blazing funeral pyres set me wondering if Pompeii had not looked like this during its last days.
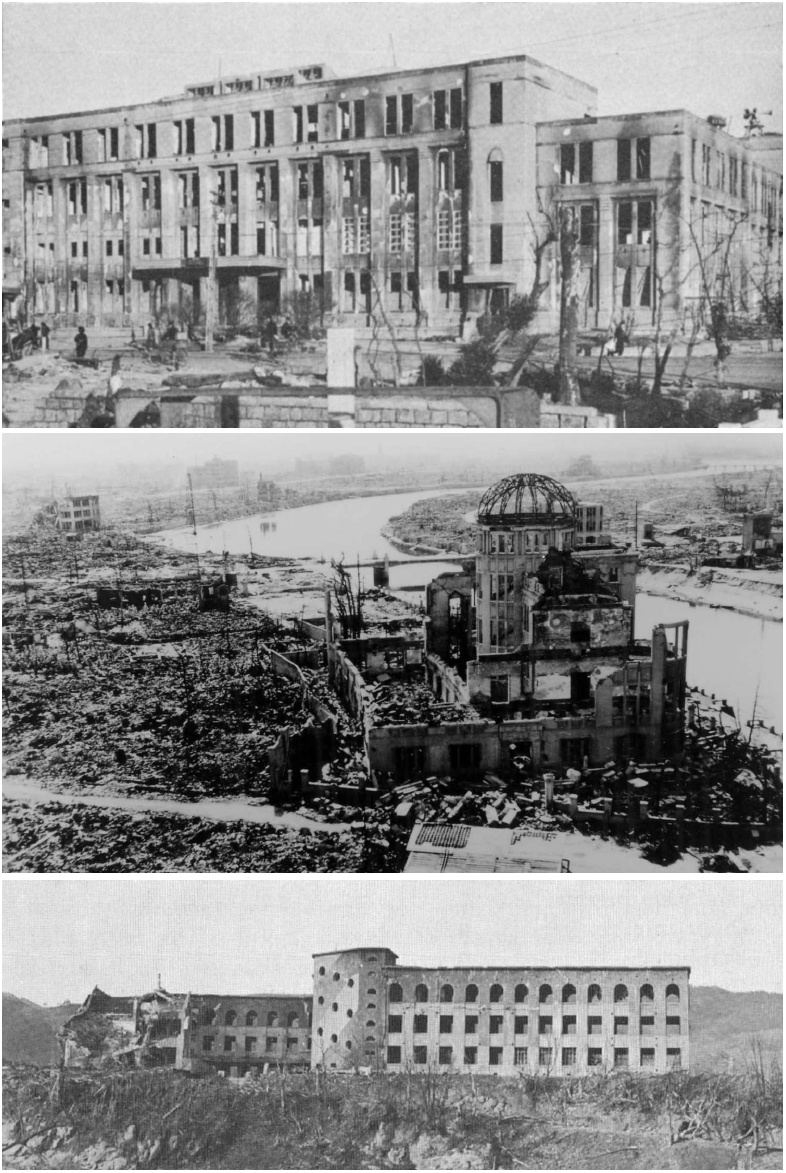
The tenor of this quote and of the preceding one from Kawano et al. [82] certainly match the impressions conveyed by photographs of the scorched and destroyed city. The pictures in Figure 5.3 show three buildings from which samples were obtained that were allegedly used with success for thermoluminescence measurements. The fires that left their marks on these buildings broke out some time after the attack, that is, after the bricks and tiles would have had received their dose of γ-rays and been activated for thermoluminescence. Now, maybe we can’t be absolutely sure that every single brick or tile from such a building would have been thermally discharged in the conflagration; but at the very least, a lot of them must have been, and thus a large proportion of duds would have been among the samples later collected from these buildings for thermoluminescence measurements.66
A similar problem arises in connection with the intense flash of light and thermal energy released by the detonation. The heat is said to have etched the surfaces of unshaded granite tombstones, and so reliably and regularly that from the outlines of the shadows thus produced the epicenters of the explosions in both cities could be determined with high accuracy (see for example Hubbell et al. [85] and Figures 13.3 and 13.4). Figure 5.2B shows a a roof tile which was collected at 270 m from the hypocenter in Nagasaki, and whose surface corrosion is portrayed as the direct effect of the thermal flash [8]. If this is true, then several of Hashizume’s samples, which were collected at similar or even shorter distances from the hypocenters in both cities, should have shown similar thermal damage to the surface; for as the authors insist, the samples were exposed to the γ-rays without obstruction, and therefore also to the thermal flash.
Considering that such damage only occurs at temperatures substantially higher than those used in their thermoluminescence experiments, it will have occurred to them that thermal inactivation must at the very least be considered and measured in control experiments. They already had found a technique that would suit this purpose, namely, the comparison of thermoluminescence in superficial layers to that in deeper ones (see Figure 5.2A). That they do not even mention the problem means that their work is unreliable; and so is any such study that does not admit to and convincingly address the problem of thermal sample inactivation. So far I have found not one study that convincingly clears this bar.67
| 5.4 |
Appraisal of reported luminescence data |
Higashimura et al. [80] report only the final numbers in terms of γ-dose at different distances from the hypocenter, so the reader is given no opportunity to judge the actual experimental data obtained by these authors. However, the more detailed study by Hashizume et al. [81], while also showing only very few of its raw glow curves, does give the luminescence intensities determined from them (see their Table 2). It also gives the formula used to calculate the γ-ray dose from the luminescence values:
| γ-Dose | = | \( L \times G \times C \times R \) | (5.1) |
In this equation, L is the bomb-induced thermoluminescence measured in the first heating run on each sample, whereas G, C, and R are calibration and correction factors. The most important one of these is G, the calibration factor that gives the amount of γ-rays required to induce a certain luminescence response (γ/L), as determined from the second heating run. C is a factor that corrects for the orientation in situ of each sample relative to the incident γ-rays; this number varies only from 1.09 to 1.31 and thus has a minor effect on the overall result. R is supposed to correct for fading between the times of activation and of measurement; no value is given for it, but using the very long lifetime which the authors assume for the luminescence peak q (see Table 5.1) its value will be very close to 1.
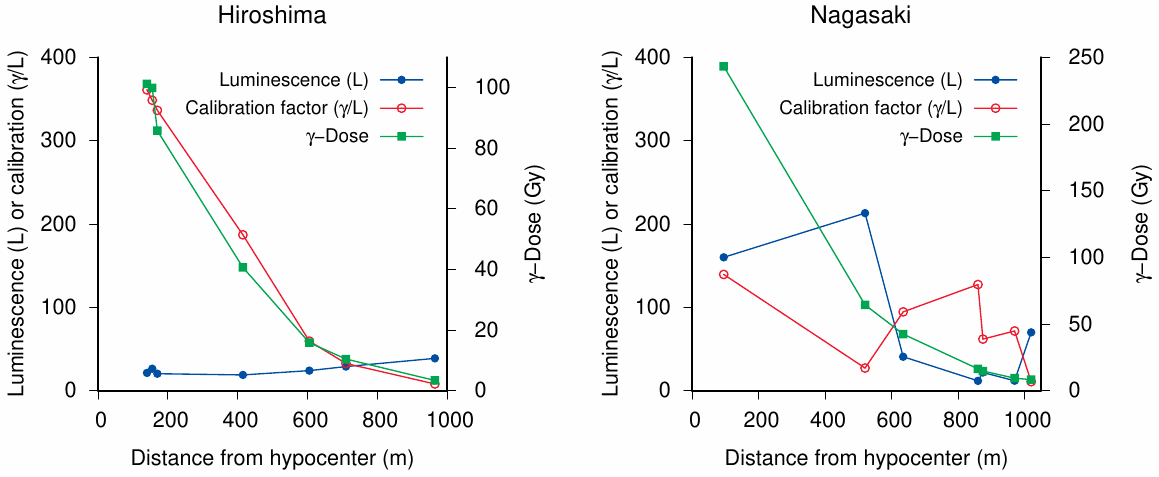
With this in mind, one surely would expect any major change in the γ-dose to correlate with major changes in L also, which therefore should assume its highest value near the hypocenter, while variations due to the correction factors should be relatively minor. This is, however, not what we find. Figure 5.4A shows Hashizume’s data from Hiroshima. We see that the raw data for L vary only slightly, and in fact reach their highest value at the greatest distance from the hypocenter. Nevertheless, a strong and regular decreasing trend is shown for the γ-dose, which is entirely due to a closely similar trend in the γ/L calibration factors.
After recovering from the surprise, we might wonder if it is physically plausible that bricks and tiles, which likely are quite similar in chemical composition, should show such large variation in their sensitivity to activation by γ-rays. This is a valid question, but I will not pursue it and only note that Hashizume et al. do not discuss it either. Instead, I will ask a simpler one: assuming that indeed the calibration factors may physically vary to such a large extent, how statistically likely is it that they should do so in this very order, monotonously decreasing with increasing distance from the hypocenter? Since we have seven different values overall, that probability is 1/7!=1/5040, or close to 0.0002.
The raw luminescence readings are substantially higher and more variable in samples from Nagasaki than in those from Hiroshima (Figure 5.4B). Remarkably, however, the calibration factors vary exactly the opposite way, going up each time that L goes down, and down each time that L goes up, once more producing a smooth and regular curve for the γ-ray dose as a function of distance from the hypocenter.68 With again seven values overall and thus six transitions between them, the probability that they all would correspond this way by chance is 1/26 or 1/64. While this is almost a hundred times greater than the probability of the more regular trend in Hiroshima, it is still less than 5%, the threshold below which we conventionally reject random as a valid explanation. Thus, the results from both Hiroshima and Nagasaki independently fail the test of statistical plausibility; that both of them should have turned out this way by chance strains credulity past the breaking point.
| 5.5 |
Conclusion |
In this chapter, we examined two early and influential thermoluminescence studies that are still widely cited as evidence of γ-radiation from the detonations in Hiroshima and Nagasaki. We saw that in both studies essential precautions and controls are absent. Even more startlingly, in the one study that actually details at least some of its experimental results, the purported evidence of γ-radiation from the bomb is not apparent in the actual measurements of the bomb-induced thermoluminescence, but depends entirely on the stated results of the calibration procedure, whose falsity can be inferred from probabilistic arguments alone.
Since Hashizume et al. [81] obviously fabricated their evidence of γ-radiation, one may ask: why did they falsify the calibration factors rather than the readings of bomb-induced luminescence? The latter would have been more direct and also far more credible. I can’t help thinking that they did it for this very reason—they wanted to be found out, to let the world know that their report was untruthful, while ostensibly conforming to the official lies and censorship imposed on them. Of course, this is just my own reading, which I cannot prove; readers will judge for themselves.
There is a number of more recent studies that use the same experimental approach, report largely similar findings, and are equally unconvincing with respect to sample selection. A fairly recent overview of the state of the ‘art’ has been given by Egbert and Kerr [84], who list two of the burnt-out buildings shown in Figure 5.3 as sampling sites. Remarkably, these authors also suggest that with some samples, particularly from Hiroshima, thermoluminescence activation arose not from direct γ-irradiation during the detonation but rather from radioactive fallout deposited on the samples.
As we will see later, the idea of strong, short-lived fallout has been invoked to account for otherwise inexplicable findings of acute ‘radiation’ sickness in many people who were not in Hiroshima during the bombing but entered the city shortly afterward (Section 8.7). Egbert and Kerr’s thesis may have been invented to prop up this story, which is otherwise entirely without observational foundation.
To advance their argument, the authors propose some highly speculative scenarios to conjure up the requisite high levels of fallout activity, such as neutron activation of sodium chloride in brackish river water, which was then swirled up by the blast wave and deposited on the surfaces of the sample materials in question. To explain why correspondingly high levels of fallout activity were not detected in later direct measurements, they suggest that the deposited fallout was subsequently washed off by the strong rainfalls which lashed both cities during September. However, they neglect to mention the findings of very low activity in early field surveys (see Chapter 4) as well as in soil samples which had been collected and measured only a few days after the Hiroshima bombing (see Section 3.2). These findings conclusively falsify Egbert and Kerr’s specious idea of high initial fallout radioactivity.