| 11 |
The radiation dose estimates used in studies on survivors |
This chapter describes how individual radiation dose estimates were produced for each survivor of the ‘atomic’ bombs, and it then examines the correlation of these estimates with biological outcomes. We will see that
- serious efforts to determine radiation doses began belatedly, after a prolonged period of general neglect and strict censorship of medical research;
- the T65D dosimetry scheme, published in the 1960s, provided individual dose estimates, which were based on radiation measurements during later bomb tests, in combination with each survivor’s distance from the hypocenter and extent of shielding against radiation by his environment. These dose estimates correlate very poorly with biological outcomes, in particular acute radiation sickness and somatic chromosome aberrations;
- the DS86 dosimetry scheme brought major changes to global and individual dose estimates, but it did not reduce the discrepancies between individual dose estimates and biological outcomes.
The collective findings show that the genotoxic effects in individual bombing victims do not correspond closely to their personalized dose estimates. The pervasive use of these flawed estimates in survivor studies has marred not only those studies themselves, but also radiation biology and medicine in general.
| 11.1 |
The Atomic Bomb Casualty Commission (ABCC) |
After the ‘Joint Commission’ (see Section 8.4) had ended its investigations in late 1945, nothing much happened for a while in the way of systematic medical studies on the bombing survivors. In 1947, the Atomic Bomb Casualty Commission (ABCC) was set up. While minimally staffed and equipped in its early stages [201], it had grown considerably by 1950, when its staff exceeded 1,000 members, most of whom were Japanese [202]. However, it was slow to produce, or at least to publish, any data on the medical condition of the survivors. A first report on the blood cell counts of 924 bombing survivors in Hiroshima, and a matched control group from the neighboring city of Kure, appeared only in 1949; the study noticed only minor residual effects in highly exposed bombing victims [203]. During this early era, Japanese scientists and physicians were subject to strict censorship, and almost none of their work was allowed to be published, with many manuscripts disappearing without a trace and often without even so much as a negative decision [15,41].
Thus prevented from spreading their wings, the physicians at ABCC appear to have simply confined themselves to their daily routine work. Accordingly, the most important initial findings were first reported by independent workers. As noted in Section 8.7, the crucial finding of widespread radiation sickness among late entrants to the inner city was made by an astute and energetic physician from Hiroshima with no affiliation to the ABCC. The same applies to the initial observation of leukemia in bombing survivors [204]:
The first intimation that leukemia was elevated among the survivors arose through the perceptiveness of a young Japanese physician, Takuso Yamawaki. As early as 1949, he believed that he was seeing more cases of leukemia in his clinical practice than he expected, and he sought the advice of hematologists at the Atomic Bomb Casualty Commission, who confirmed his diagnoses. This finding, the first evidence of a possible increase in any cancer among the survivors, immediately prompted an effort to confirm and extend what apparently was being seen. The task was made difficult, however, by the absence of individual dose estimates, the lack of a systematic case-finding mechanism, and uncertainties about the size of the population at risk.
The concluding sentence of the quote illuminates what the ABCC had or had not accomplished until 1949. While some surveillance studies on at least the most severely affected survivors were underway in the early 1950s, these were criticized in 1955 by an outside review panel for their lack of focus and of proper control groups, as well as for high participant attrition [205]. This panel, known as the Francis committee, also noted the lack of individual radiation dose estimates: nobody at ABCC was quite certain how much radiation had been received by any of the patients or study subjects they were dealing with. This uncertainty led to the following absurd argument among four ABCC geneticists, who were surveying possible genetic effects of radiation in children then being born to mothers who had survived the bombings [41, p. 201f.]:
When a survivor said she had been distant from the hypocenter, but reported experiencing severe radiation sickness, she could conceivably be placed in one of two different categories … Morton felt that reported distance was more reliable than reported symptoms … Neel took the opposite position … McDonald sided with Morton, Schull sided with Neel, and the debate raged on for some weeks, with much anecdotal evidence proffered by both sides.
It seems to have escaped the combatants’ notice that they were in fact all agreed on the same principle: the data should be bent out of shape to fit the same preconceived notion, namely, that radiation sickness could only have occurred near the hypocenter. Their argument merely concerned the technical question of which way to bend the data.140
| 11.2 |
Establishment of individual dose estimates |
The Francis committee’s recommendations finally led to the design and implementation of two large-scale, long-term surveillance programs that are still ongoing, namely, the ‘Life Span Study’ and the ‘Adult Health Study’. In support of these studies, a major effort was also undertaken to determine the individual doses of radiation that each of the enrolled study subjects would have received in the bombings. As described by Jablon et al. [207] and in more detail by Auxier [36], various true-to-scale, open-air physical experiments were carried out, often in conjunction with ongoing nuclear bomb tests, in order to determine the in-air doses of γ- and neutron radiation that would have prevailed at various distances from the hypocenters in Hiroshima and Nagasaki, as well as the shielding characteristics of traditional Japanese buildings.
The results of these measurements were then used to derive the individual radiation doses by taking into account the specifics of location and shielding for each survivor, as gathered from detailed interviews. The interviews presented their own difficulties, because the mystery survivors from near the hypocenters put in another appearance; but these were resolutely dealt with by the undaunted investigators. Seymour Jablon, an American statistician with the ABCC, recounts [208]:
Although some persons report being in the open at close distances, the stories must be considered as mistaken, since the intensity of blast and heat effects at near distances were such as to make survival impossible … Survivors who stoutly aver such experiences may be sincere in their statements; however, there is a possibility of post concussion amnesia with a resulting erroneous story. … The fact that so few survivors do not remember the details of the event may be taken to imply that those survivors who are amnesic for the explosion have substituted for their actual experiences a satisfactory surrogate.
In other words, survivors who had been very near the hypocenter and should have died, but hadn’t, and who furthermore had not noticed the large explosion that should have killed them, but hadn’t, were declared ‘amnesic’ forthwith. Based on this ‘diagnosis’, their entire recollection was then discarded as an elaborate fantasy. This crafty and robust approach allowed the interviewers to prevail over all contrary evidence.
The initial set of dose estimates thus obtained became known as ‘Tentative 65 Doses’ (T65D). The T65D system was used from the late 1960s [209] until the publication of Loewe and Mendelsohn’s revised estimates in the early 1980s; these were subsequently endorsed as the ‘Dosimetry Scheme 1986’ (DS86; see Section 11.5). A further, fairly minor modification occurred in 2002 (DS02). Ever since their inception, these dose estimates have been used by the ABCC and by its successor organization, the ‘Radiation Effects Research Foundation’ (RERF), as the frame of reference for interpreting any and all medical observations on the survivors in Hiroshima and Nagasaki. The studies published by this institution have greatly influenced the scientific literature on radiation biology and medicine (see for example [210,211]). However, can the dose estimates used in these studies be trusted?
| 11.3 |
Correlation of radiation dose estimates with ARS symptoms |
Figure 11.1A shows some proper radiation dose-response curves, which were obtained in rhesus monkeys exposed to mixed γ- and neutron radiation during a series of bomb tests, as well as in mice experimentally exposed to X-rays. While the mice can tolerate higher radiation doses than the monkeys,141 both curves exhibit a very steep, clearcut transition from very low levels of response—in this case, mortality—to very high ones; doses that cause almost complete mortality exceed those which cause virtually none by a factor of no more than 2. The results obtained with rhesus monkeys, in particular, are more than merely illustrative, since these monkeys are physiologically similar to humans and thus provide the best available animal model for estimating human radiosensitivity.142
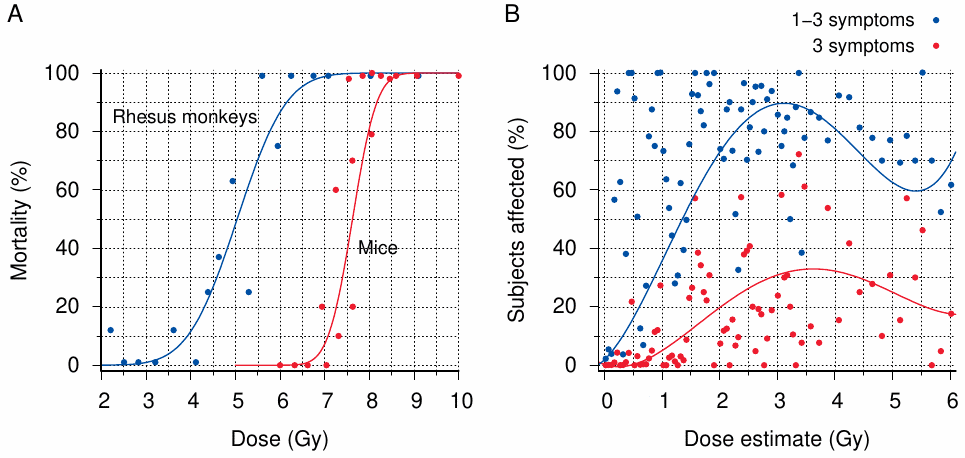
With acute radiation sickness in humans, we should expect dose-response curves shifted to the left relative to the rhesus monkey curve in Figure 11.1A, yet they should be similar in shape. Characteristic symptoms such as bleeding, epilation, and oropharyngeal ulcers should be rare below 2 Gy but regularly present beyond twice that dose [149]. This is, however, not at all what we see in Figure 11.1B. The dose estimates and associated symptom frequencies shown in this graph were obtained from a dataset published by RERF;143 adjoining dose ranges were here merged as needed so that each data point in the graph is drawn from a sample of at least 10 subjects (but some data points, particularly at or near 0 Gy, represent many more individuals). The incidence of symptoms scatters widely across almost the entire dose range; it reaches high levels in some dose groups well below 2 Gy, while failing to reach saturation even as the dose approaches a presumably fatal level (6 Gy). Clearly, the estimated dose is a very poor predictor of the biological outcome.
| 11.4 |
Dose estimates and somatic chromosome aberrations |
Another biological end point that we can compare to estimated radiation doses are chromosome aberrations in somatic cells. Many readers will be familiar with the concept of inherited chromosomal aberrations. One example is Down syndrome, which is caused by an extra (third) copy of chromosome 21; others are Turner syndrome (one of two X chromosomes is missing in women) or Klinefelter syndrome (an extra X chromosome is present in men).
| 11.4.1 |
Biological background |
While some specific chromosome aberrations give rise to genetic diseases, most aberrations are not heritable, since they will be lethal in early embryonic development. However, they may persist when introduced not into the germline cells but instead into somatic (body) cells of adults or also of children. In the context of radiation damage, chromosomal aberrations begin with DNA double strand breaks in one or more chromosomes, followed by faulty rejoining of the fragments. Even though most such breaks will be resealed properly by DNA repair enzymes, the abundance of chromosome aberrations after irradiation is remarkably high. Furthermore, with proper experimental precautions, a fairly regular relationship can be observed between the radiation dose and the frequency of chromosome aberrations; this can be used for the approximate determination of radiation doses received for example in nuclear accidents [214,215].
Chromosomes are observable, in their picture-book crossed-pair-of-sausages form, only during cell division (mitosis), and more specifically only during its metaphase, that is, the stage immediately before the two chromatids (the individual sausages) of each chromosome are pulled apart to join the separate nuclei of the incipient daughter cells. For most of the lifetime of the daughter cells, each chromatid will remain single, and it is for the most part at this stage that radiation will produce the characteristic lesions. Any lesions that are not properly repaired will then be copied into a new second chromatid shortly before the next mitosis, which explains why aberrations are typically visible in both chromatids at that stage.
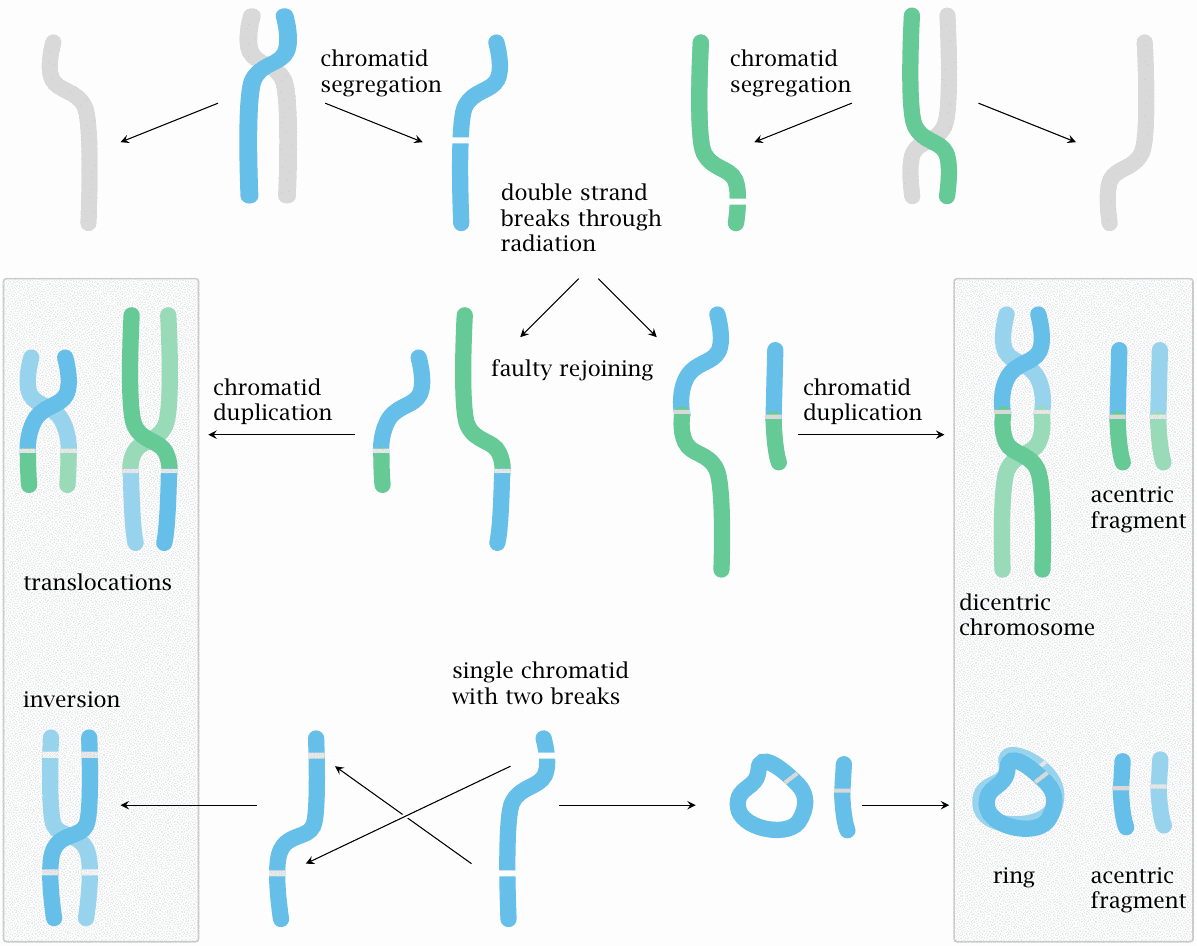
A crucial part of each chromosome is its centromer, which is where the two chromatids are joined together, and also where the mitotic spindle—the apparatus of structural and motile proteins that will pull the two chromatids apart—attaches. For chromatid separation and segregation into the two daughter nuclei to work reliably, each chromosome must have exactly one centromer. This is the case with all intact chromosomes, but it may not be so with the aberrant ones which form downstream of radiation damage (Figure 11.2). Aberrant forms with zero or two centromers may go missing from one or both daughter nuclei during cell division. They can therefore be reliably counted only in cells that enter their very first mitosis after the radiation exposure.
In diagnostic practice, chromosome aberrations are observed and counted in lymphocytes, a particular type of white blood cells (leukocytes) that are crucial for producing antibodies, for killing virus-infected cells, and for other functions of the specific immune system. Lymphocytes have a typical life span of four to five years. Unless stimulated by the presence of their specific cognate antigens—for example, lymphocyte A may recognize and be activated by measles virus, while lymphocyte B might react to tetanus vaccine—they tend to be dormant, i.e. to not undergo any cell divisions. When they are isolated from a blood sample, they can be artificially induced to divide using certain non-specific mitogens. In these artificially induced and synchronized mitoses, we can expect to find both stable and unstable chromosome aberrations at high frequency, as long as both irradiation and examination occur within the time frame of the regular lymphocyte lifespan. However, as the pool of irradiated, dormant lymphocytes is replaced after several years with newly formed cells, the unstable chromosome aberrations tend to diminish [216]; and furthermore, we must expect the rate of lymphocyte attrition, and therefore of loss of unstable aberrations, to vary among individuals.
The techniques for quantifying chromosome aberrations were developed around 1960, that is, a considerable time after the bombings of Hiroshima and Nagasaki; and the first such studies on the survivors appeared in the 1960s [217–219]. Nevertheless, these early studies relied mostly on unstable aberrations, which are more conspicuous (see Figure 11.2) and thus easier to observe and count experimentally. Because of the inherent variability that must be assumed in these data, we will not discuss them in detail; instead, we will focus on later studies that quantified stable aberrations [220–222].
After the passage of sufficient time, as was the case with the A-bomb survivors, the genetic makeup of the peripheral blood lymphocytes should resemble that of the bone marrow stem cells, from which all lymphocytes are ultimately descended, and which will self-renew throughout life. Once such a state has been reached, we would expect most of the observed aberrations to be of stable varieties, and furthermore that the aberration frequency in a given individual should be constant over time. Long-term surveillance of several accidentally irradiated subjects suggests that the frequency is indeed stable [215,216,223]. However, some stable chromosome translocations may affect the proliferation rate of the cells that contain them, which would then increase or decrease the abundance of these particular cell clones. In special cases, proliferation may be increased to the point of inducing leukemia; in particular, chronic myeloic leukemia is typically caused by the so-called Philadelphia chromosome, which arises through a translocation between chromosomes 9 and 22 that creates a growth-promoting aberrant gene at one of the two faulty fusion sites.
One more point should be noted before we delve into the data: any and all of the above radiation effects can also be observed with DNA-alkylating agents, including nitrogen mustard [224] and also sulfur mustard. The latter has been shown in former workers of a Japanese poison gas factory [225].144
| 11.4.2 |
Stable chromosome aberrations observed in survivors |
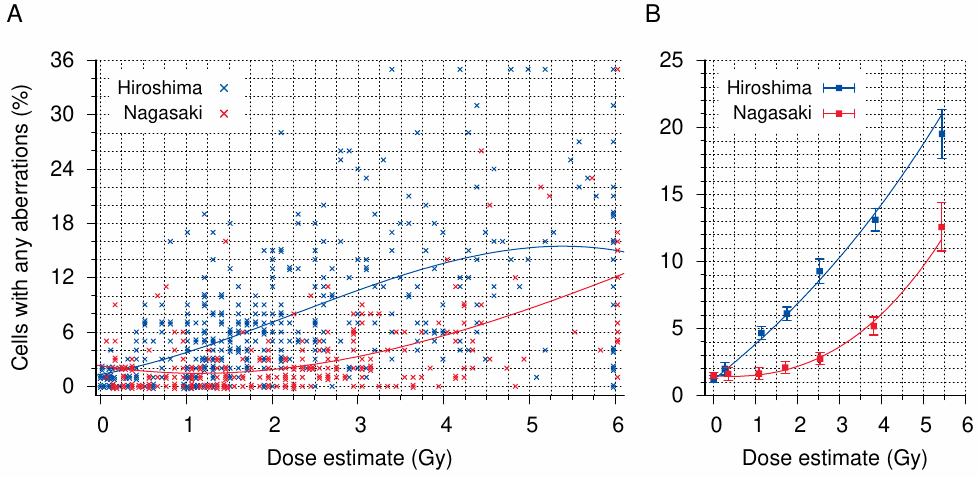
Figure 11.3 summarizes the chromosome aberration study by Otake [220]. Shown here are the frequencies of cells with any aberrations, but the data in Table 2 of the reference indicate that 85-90% of these aberrations are in fact stable translocations. This agrees with the length of time that has passed between the irradiation and the measurement—most unstable aberrations should by then have been washed out by successive rounds of cell division.
Panel A in the figure shows estimated radiation doses and frequencies of cells with one or more aberrations for individual subjects from Hiroshima and Nagasaki. As seen before with the symptoms of radiation sickness (Figure 11.1),145 the most obvious and dominant feature of this graph is the very high degree of scatter—throughout most of the dose range, the frequency of cells with aberrations can be anything from 0 to 20% or more.146 This means, of course, that the assigned dose estimates have almost no predictive value—if at a given dose any extent of chromosome damage can occur, then of course any extent of any other biological effect can occur as well. We have already seen this with acute radiation sickness, and we will in Chapter 12 see the same effect with fetal malformations also.
Before we leave Otake’s study, we should take a look at the inferences that he was able to draw from the data shown in Figure 11.3 A. In preparation for this exercise, the author
chose dose intervals so as to present as smooth a curve as practicable based upon the frequency of aberrant cells in the two cities and the sample size in each dose interval.
For each of these groups, he then calculated a ‘95% confidence interval’. Considering that these intervals often don’t overlap between adjacent dose groups (see Figure 11.3 B), and accordingly that about half of the individual data points shown in panel A are not comprised within them, he can only mean that we should be 95% confident in his averages. These are, of course, about as useful for predicting individual aberration frequencies as is the annual average temperature in Oklahoma City when it comes to packing one’s suitcase for a journey to the place.147
Otake next uses his averages to choose between several quantitative models of the relationship between dose estimates and chromosome aberrations. Taking into consideration that, according to the T65D dose estimates then in force, Hiroshima received significant neutron radiation, whereas Nagasaki did not, he infers from the two dose-response curves shown in Figure 11.3B that the frequency of aberrations is linear with respect to the neutron dose, but varies with the third power of the γ-dose. Furthermore, he derives estimates, again complete with ‘confidence intervals’, for the relative biological effectiveness of (RBE) neutrons as compared to γ-rays.
While the linear relationship with neutrons and other particles that with high linear energy transfer agrees with conventional wisdom,148 most other pertinent studies assert that low LET radiation (γ-rays) acts in proportion to the square of the dose or to a linear-quadratic combination. Regardless of what the truth of the matter may be, it seems an extraordinary proposition to decide such subtle differences based on data that scatter as widely as those in Figure 11.3A. The matter was soon forgotten, however, because shortly after the publication of Otake’s study Loewe and Mendelsohn’s ‘new and improved’ dosimetry scheme largely did away with the neutron contribution in Hiroshima altogether (see Section 11.5).
Even though Otake’s conclusions are unconvincing, his study does at least give us a glimpse of the actual experimental data. This is the exception in the works released by RERF; for example, a study published under RERF’s auspices by Awa [221] presents only a summary graph similar to Figure 11.3B above, without even hinting at the variability of the underlying data. Awa was, however, very much aware of the problem, as is evident from the following conversation, recorded a few years ago at an internal RERF history forum [228]:
- Awa:
- We found several unbelievable cases while examining the relationship between dose estimates and chromosome aberration frequencies. They included proximally exposed survivors with no chromosome aberrations and distally exposed survivors with chromosome aberrations. We called them DCs (discrepancy cases), cases with a discrepancy from prediction. I assume those cases included individuals who wanted to hide the fact that they had been exposed to A-bomb radiation for marriage or various other reasons.
- Teramoto [interviewer]:
- Was there a dispute between the Departments of Statistics and Genetics over the interpretation of this discrepancy?
- Awa:
- Yes, and each group refused to yield.
- Teramoto:
- By that time, the biennial blood sample collection from AHS [Adult Health Study] participants had already begun. I assume researchers examined samples collected from the same subjects on multiple occasions and concluded that the argument of your group was correct.
- Awa:
- Yes. We examined each sample many times, in some cases as many as 10 times, and determined that no individual variation was involved.
Awa’s suggestion that false assertions of low exposure stemmed from concern over marriage prospects is intriguing—might high exposure have been claimed untruthfully by those keen to avoid marriage? More seriously, though, the debate over these discordant cases is of course appropriate—if the radiation dose estimates were indeed valid, then such discrepancies really should not occur, at least not in the abundance evident from Figure 11.3 A. Awa, the geneticist, deserves credit for siding with the facts, even if they did not fit the narrative; to omit any mention of the problems from his published works may not have been his own choice.
| 11.5 |
The DS86 dosimetry scheme |
Above, we saw that the average extent of chromosome damage rose more steeply with T65D radiation dose in Hiroshima than it did in Nagasaki. Similar trends had been noted earlier with the incidence of acute radiation sickness [207] and of leukemia [229]. In its 1980 report on the biological effects of low-dose radiation [210], the National Academy of Sciences’ expert committee placed much weight on these findings. The committee highlighted similar discrepancies between the cities in the case numbers of solid cancers and of microcephaly in children exposed in utero. It ascribed the higher case numbers in Hiroshima to the supposedly greater neutron doses in that city, and it even went so far as to base its reassessment of neutron radiation biological effectiveness (RBE) on these observations [210, p. 141]:
For radiation-protection purposes, the RBE for fast neutrons relative to gamma radiation has been fixed at 10 by standard-setting organizations … However, this Committee has chosen not to use an arbitrary average RBE for fission neutrons in its calculations, but to derive RBE estimates from the Hiroshima and Nagasaki data.
The committee was not unanimous in its conclusions regarding the cancer risk of low doses of ionizing radiation. On this point, the report contains two dissenting statements that deviate from the majority consensus in opposite directions; and both dissenters cite the data from Hiroshima and Nagasaki among their evidence.
With this much scientific and practical significance suddenly riding on their work, the gatekeepers of the official atomic bomb narrative were faced with a moment of truth. Had they been confident in their data, they could have parlayed this renewed interest and relevance into a significant boost of funding for their institutions and their work—something which is always high on the list of priorities of practicing scientists. On the other hand, this increased funding would have come with fresh blood, renewed scrutiny, and increased expectations of transparency. Thus, if conscious of the unsoundness of their data and their interpretations, the gatekeepers would have looked for a way to deflate expectations and divert interest.
This is, of course, exactly what happened next.
The gambit was first announced in the 1981 paper “Revised dose estimates at Hiroshima and Nagasaki” by Loewe and Mendelsohn [92]. The new estimates are presented as graphs which compare them to the previous T65D values. Neutron doses are revised downward, and γ-ray doses upward; both effects are more pronounced in Hiroshima than in Nagasaki. The supposed physical foundation of these new estimates is dealt with in only two paragraphs that cite no proper references whatsoever. The authors state that their calculations agree with previously measured induced 60Co activity on the ground [81]; but we have seen in Chapter 6 that Loewe and Mendelsohn’s revised dosimetry disagrees significantly and systematically with prior and subsequent neutron activation measurements.
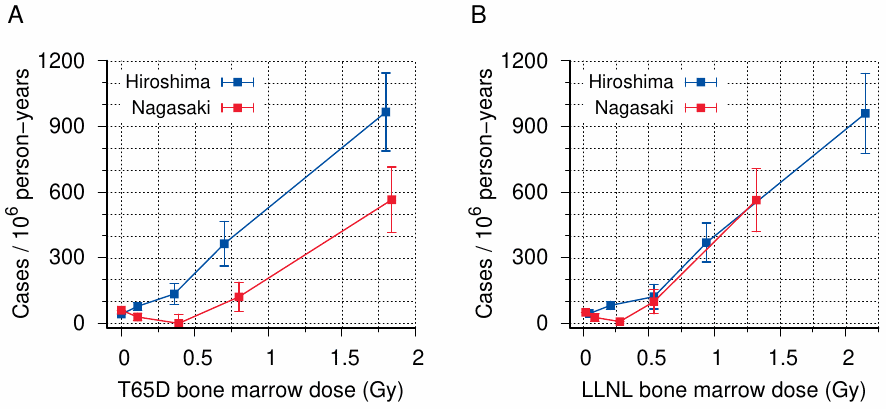
The rest of the paper strives to squash the “remarkable interest” of radiation biologists in the data from Hiroshima and Nagasaki. To this end, the authors reproduce a leukemia incidence graph published previously by Rossi and Mays [229], shown here as Figure 11.4A, and then transmogrify it by replacing the T65D doses used by those authors with their own new and improved dose estimates (Figure 11.4B). In one fell swoop, both of the circumstances that had aroused attention have disappeared: the difference in dose-response between the two cities has vanished, and the neutron component in Hiroshima has been reduced to a marginal role.
Considering that Loewe and Mendelsohn were able to present such precise dose calculations as early as 1981, it is peculiar that the new DS86 dosimetry scheme could be unveiled to the public only in 1987, when the full report was finally published by RERF [93]. While the physicists continued to argue over its validity for many years and in fact never settled their dispute conclusively, a survey of the biomedical literature after 1981 indicates that the ploy was a success: this audience bought the new dose estimates sight unseen, and their previously lively interest quickly died down.
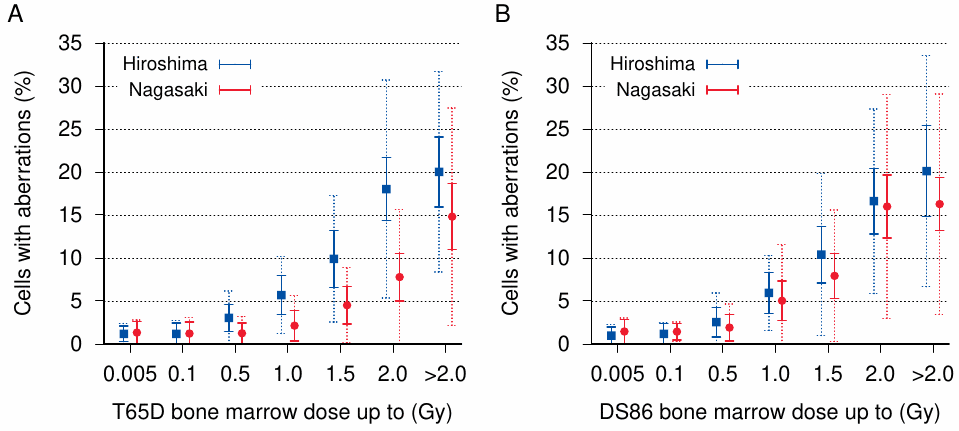
One issue that DS86 did nothing to resolve is the excessive variability of biological effects at any given estimated dose. This is illustrated for chromosome aberrations in Figure 11.5. As with the leukemia incidence, the DS86 scheme largely does away with the difference between the two cities. However, at bone marrow doses greater than 0.1 Gy, the observed standard deviation in the number of cells with aberrations is 2-3 times greater than the theoretical expectation with both dosimetry schemes. At high doses the observed standard deviation spans almost the entire range; and considering that with a Gaussian distribution nearly 3/8 of all observed values fall outside of a single standard deviation, the variability is obviously similar to that depicted in Figure 11.3. Thus, regardless of which dosimetry scheme we employ, we can expect the same kinds of systematic errors and distortions in the resulting dose-response curves.
| 11.6 |
Conclusion |
The import of this chapter is simple: the official radiation dose estimates, regardless of the flavor of the day—T65D, DS86, or the but slightly modified DS02, which was not here discussed in detail—do not reliably capture and predict the biological effects of radiation in the survivors of the bombings. This failure is of course expected if indeed there was no nuclear detonation and no radiation, save for the trifling amount of radioactivity contained in the dispersed reactor waste. Application of these fictional dose estimates to real biological outcomes will produce spurious and distorted radiation dose-response curves; it will systematically overestimate sensitivity at low doses but underestimate the effect of high doses. The error is less obvious with cancer and leukemia, which are themselves stochastic occurrences, than with deterministic radiation effects such as chromosome aberrations and acute radiation sickness. Spurious correlations can also be expected with disruptions of fetal development; this will be examined in the following chapter.