| 20 |
Appendix |
The original edition of this book does not contain an appendix; the material included in this appendix was moved here from the running text.
| 20.1 |
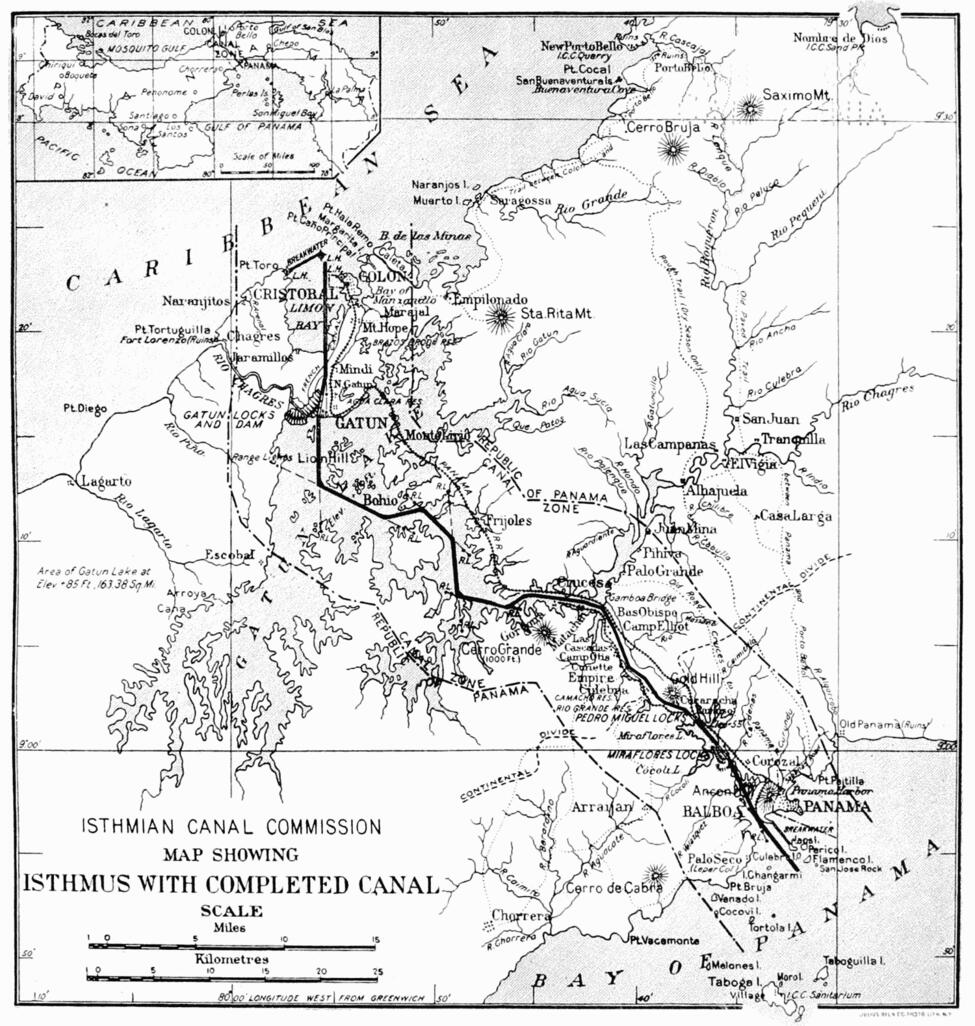
Original map of the Panama Canal zone |
| 20.3 |
Panama Sanitary Department reports |
In the original edition of the book, these examples of report forms and filed reports occur within the running text of Chapter 13. The reproductions below were prepared from the page scans of that edition.
| 20.3.1 |
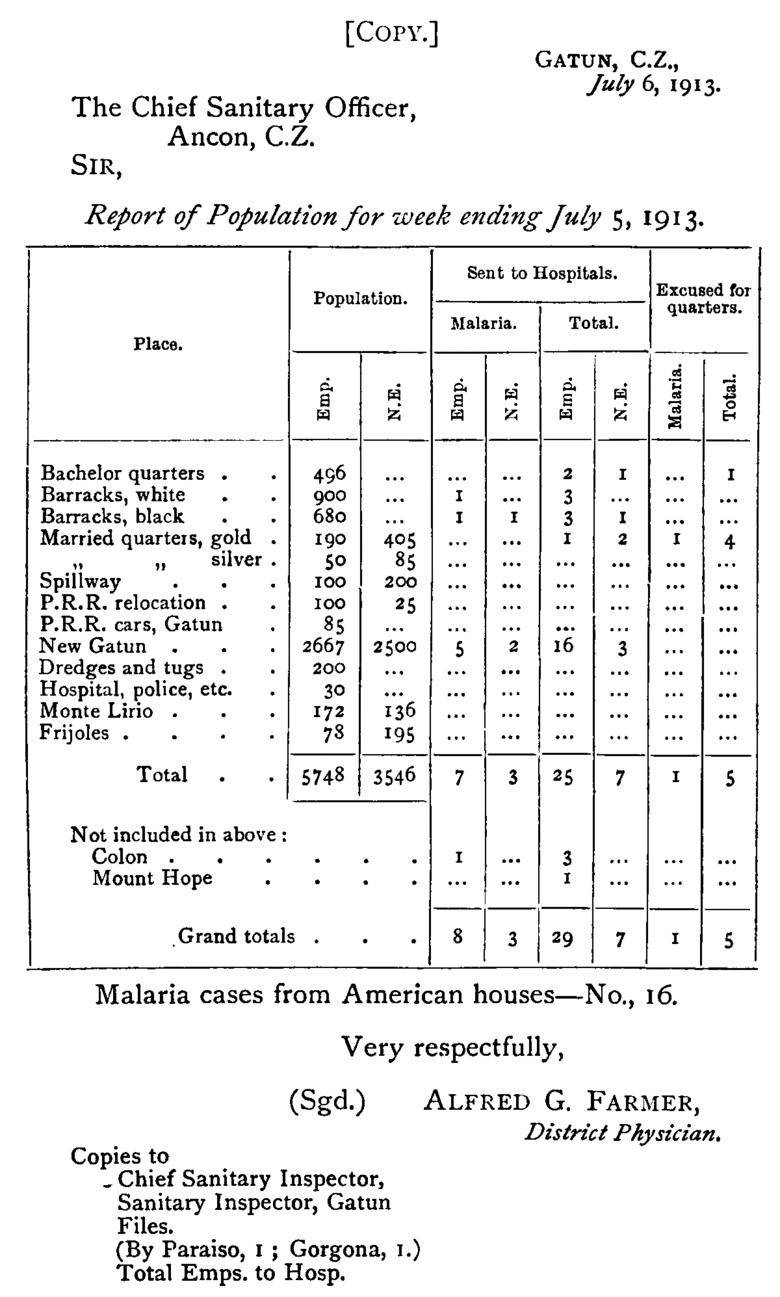
Weekly malaria report for a single district |
Report for the week ending 5th July 1913, for the sanitary district of Gatun. “Emp.” means employees, “N.E.” means non-employees.
| 20.3.2 |
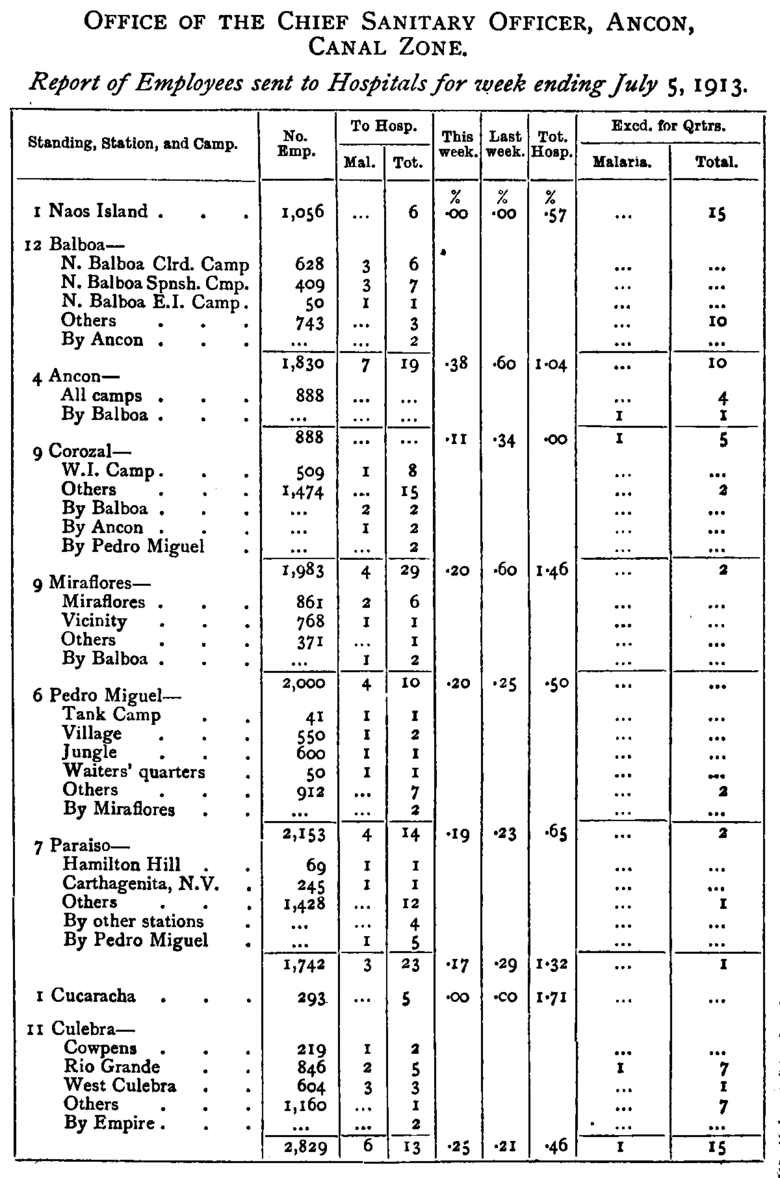
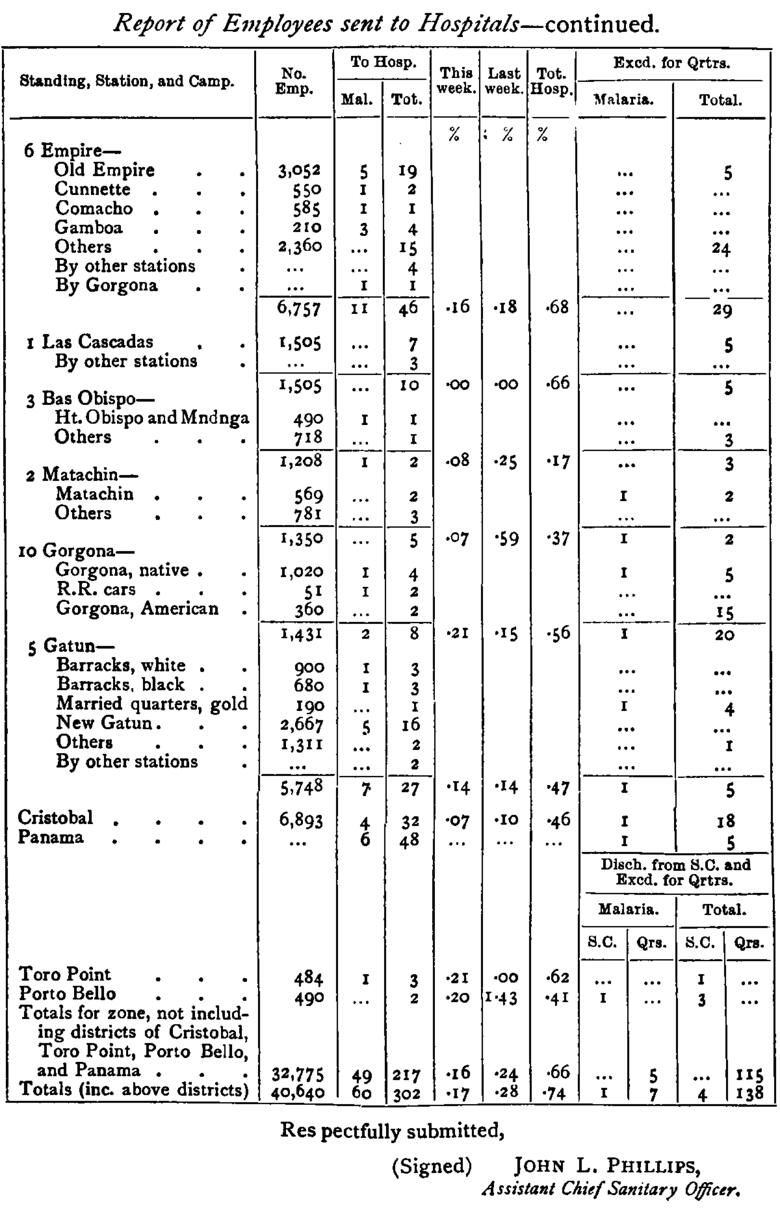
Weekly report by the Chief Sanitary Officer |
The expression “Excused for Quarters (Excd. for Qrtrs.) means given sick leave without being sent to hospital. “S.C.” means Sick Camp.
-
| 20.3.3 |
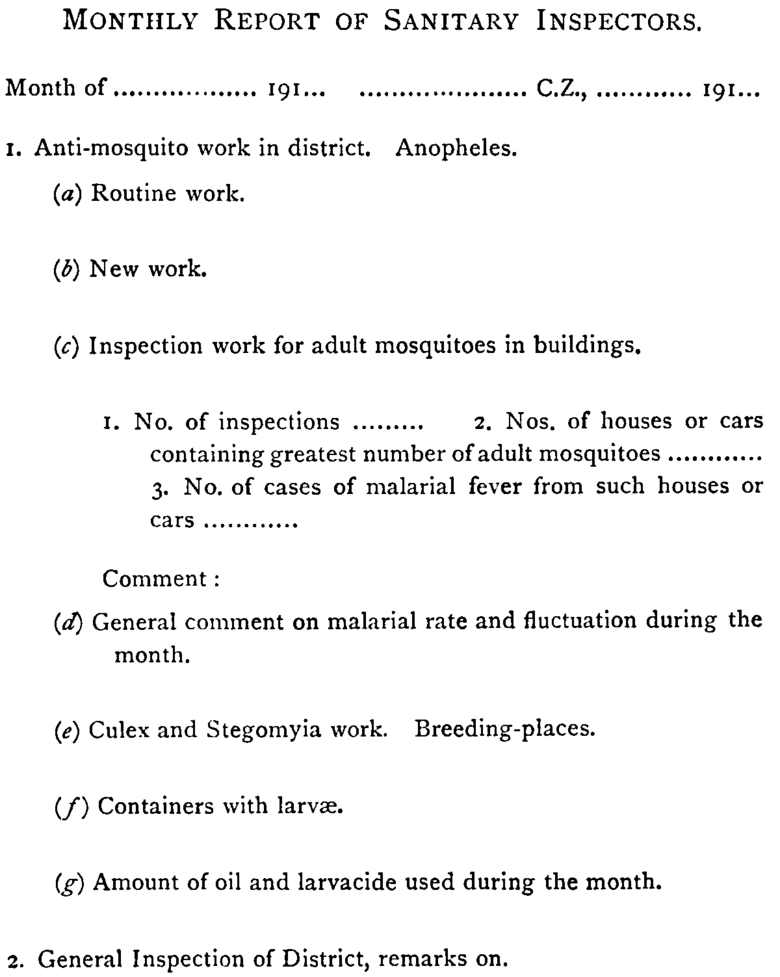
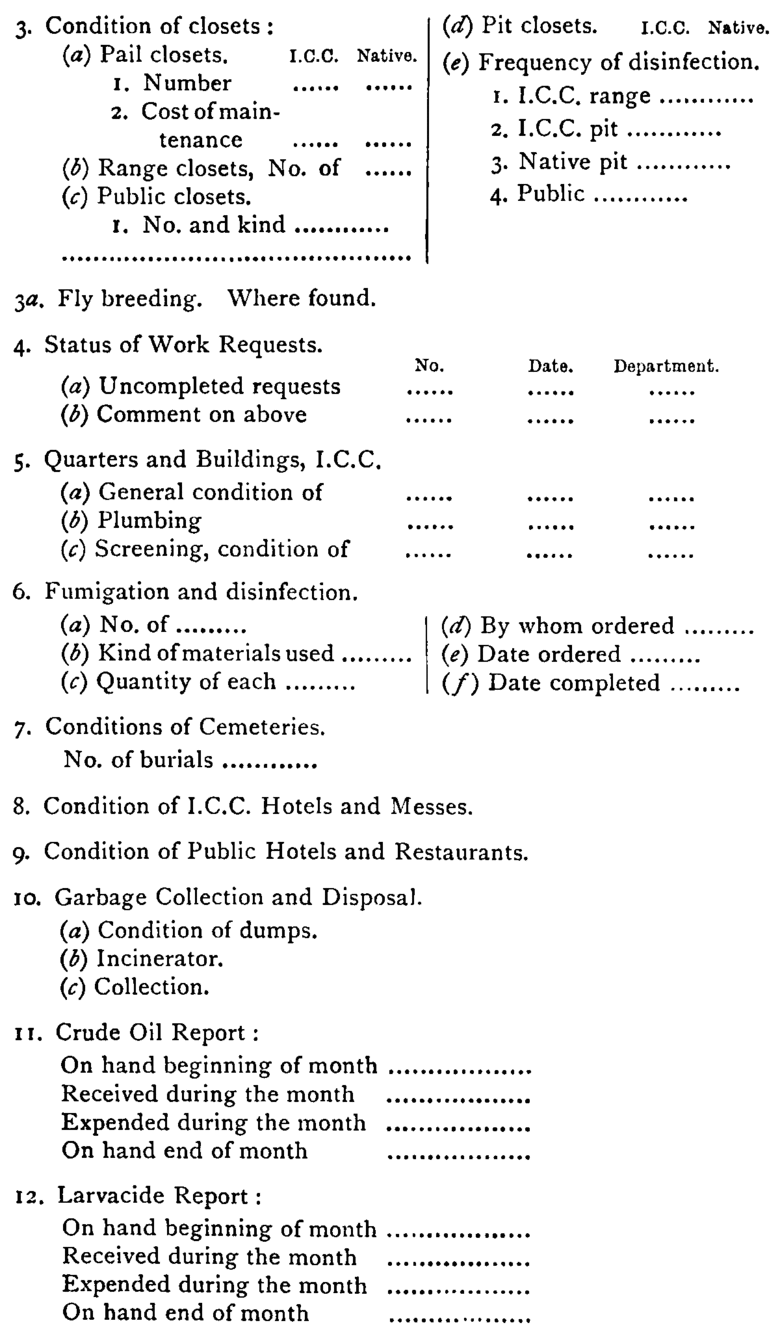
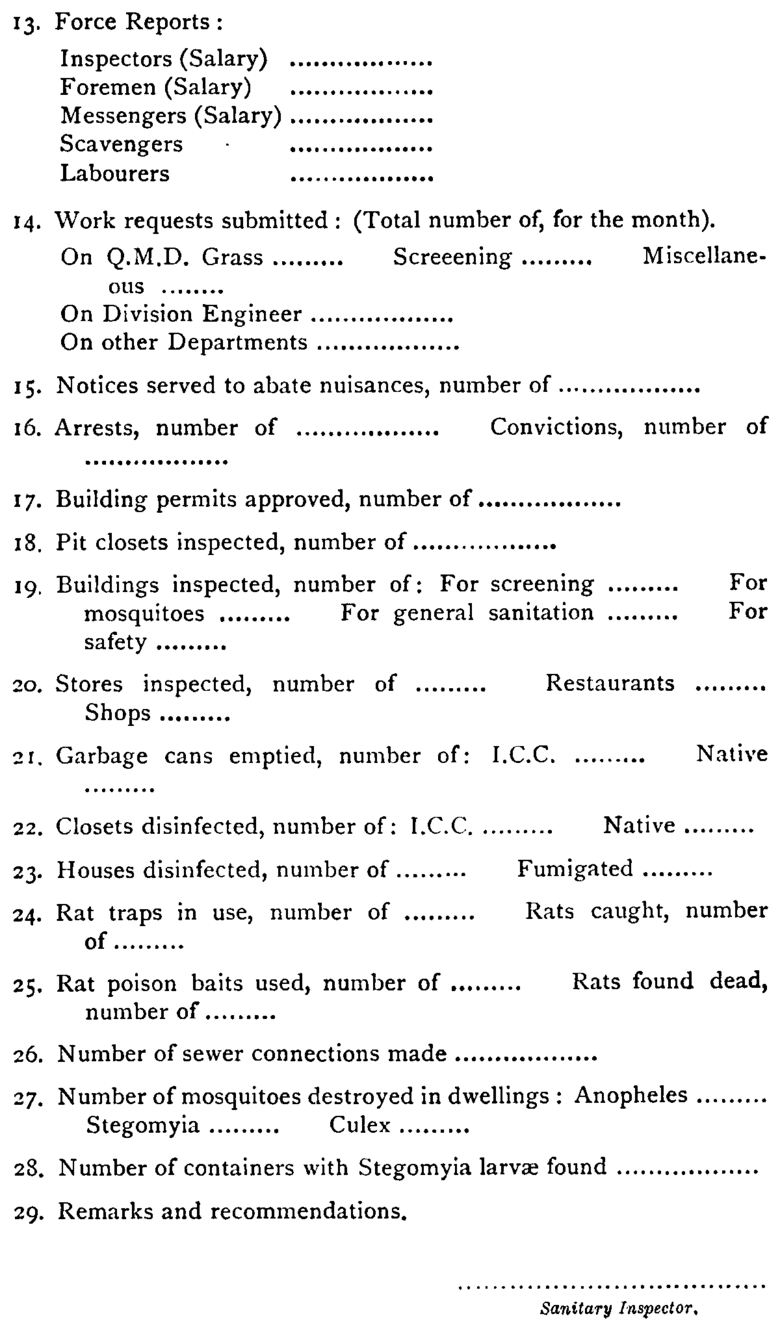
Monthly Report of Sanitary Inspectors |
A facsimile of a blank report form.
-
-
| 20.3.4 |
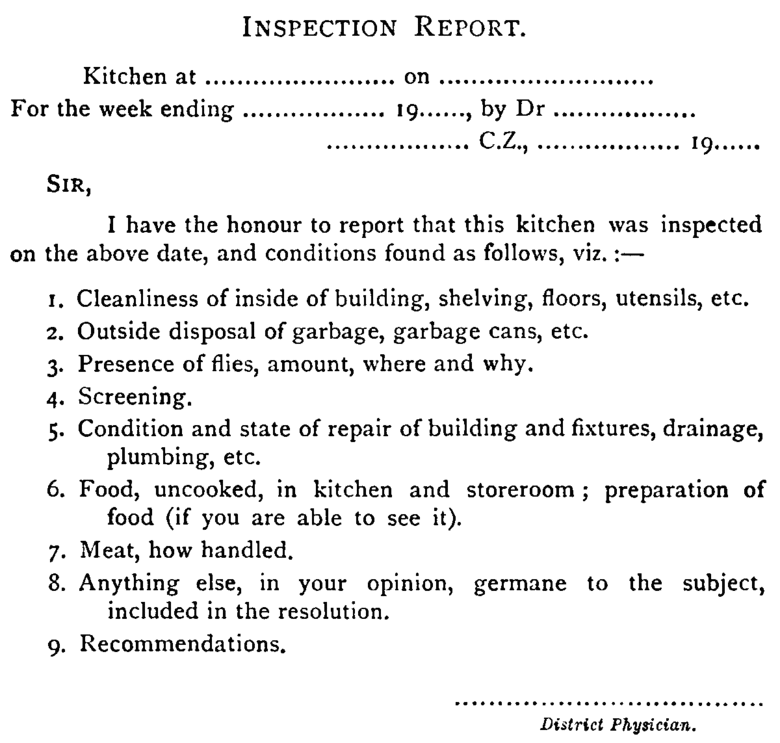
Physician’s report on kitchens |
| 20.4 |
Malaria statistics from various rural stations |
The figures in the following tables represent hospitalized malaria cases per week, in percent of the local workforce. In the original edition, these tables appeared in the running text of Section 15.8.
| 1907 | Cases (%) | 1908 | Cases (%) | |||
| Jan. | 5 | 1.13 | April | 4 | .49 | |
| 12 | 1.85 | 11 | .76 | |||
| 19 | 1.89 | 18 | .76 | |||
| 26 | 13.96 | 25 | 1.04 | |||
| Feb. | 2 | 7.76 | May | 2 | .00 | |
| 9 | 6.36 | 9 | .00 | |||
| 16 | 9.52 | 16 | .00 | |||
| 23 | 5.71 | 23 | .35 | |||
| March | 2 | 6.29 | 30 | 1.04 | ||
| 9 | 10.00 | June | 6 | .00 | ||
| 16 | 8.82 | 13 | .58 | |||
| 23 | 4.70 | 20 | .58 | |||
| 30 | 1.18 | 27 | .58 | |||
| April | 6 | 2.70 | July | 4 | .00 | |
| 13 | .00 | 11 | 4.14 | |||
| 20 | 4.50 | 18 | 1.18 | |||
| 27 | 2.70 | 25 | 1.78 | |||
| May | 4 | .00 | Aug. | 1 | .00 | |
| 11 | 1.66 | 8 | .55 | |||
| 18 | 1.32 | 15 | .00 | |||
| 25 | .93 | 22 | .55 | |||
| June | 1 | .46 | 29 | .00 | ||
| 8 | 1.86 | Sept. | 5 | .00 | ||
| 15 | .93 | 12 | .00 | |||
| 22 | 2.77 | 19 | .00 | |||
| 29 | 3.16 | 26 | .00 | |||
| Average population | 232 | Average population | 268 | |||
| 1907 | Cases (%) | 1908 | Cases (%) | |||
| Jan. | 5 | .88 | Jan. | 4 | .00 | |
| 12 | .00 | 11 | .83 | |||
| 19 | 1.20 | 18 | .00 | |||
| 26 | 1.60 | 25 | .00 | |||
| Feb. | 2 | 6.52 | Feb. | 1 | .83 | |
| 9 | 8.00 | 8 | .00 | |||
| 16 | 2.35 | 15 | .00 | |||
| 23 | 6.32 | 22 | .00 | |||
| March | 2 | 12.86 | 29 | .80 | ||
| 9 | 3.70 | March | 7 | .00 | ||
| 16 | 9.88 | 14 | .49 | |||
| 23 | 5.00 | 21 | .97 | |||
| 30 | 6.25 | 28 | .00 | |||
| April | 6 | 1.31 | April | 4 | .00 | |
| 13 | 1.31 | 11 | .00 | |||
| 20 | 2.61 | 18 | .00 | |||
| 27 | 2.61 | 25 | .97 | |||
| May | 4 | 1.31 | May | 2 | .49 | |
| 11 | 1.51 | 9 | .00 | |||
| 18 | 1.02 | 16 | .00 | |||
| 25 | 1.51 | 23 | .00 | |||
| 30 | .00 | |||||
| Average population | 173 | Average population | 170 | |||
| 1908 | Cases (%) | 1912 | Cases (%) | |||
| March | 21 | 13.33 | March | 23 | 1.58 | |
| 28 | 10.83 | 30 | 1.35 | |||
| April | 4 | 9.76 | April | 6 | .00 | |
| 11 | 18.97 | 13 | .00 | |||
| 18 | 14.62 | 20 | .35 | |||
| 25 | 11.94 | 27 | .70 | |||
| May | 2 | 5.78 | May | 4 | 1.06 | |
| 9 | 7.68 | 11 | 1.23 | |||
| 16 | 9.42 | 18 | 2.16 | |||
| 23 | 9.76 | 25 | 3.78 | |||
| 30 | 9.10 | June | 1 | 3.51 | ||
| June | 6 | 8.04 | 8 | 1.83 | ||
| 13 | 7.00 | 15 | 3.85 | |||
| 20 | 9.80 | 22 | 2.64 | |||
| 27 | 6.44 | 29 | 2.64 | |||
| July | 4 | 3.42 | July | 6 | .81 | |
| 11 | 3.25 | 13 | 1.62 | |||
| 18 | 4.43 | 20 | 1.54 | |||
| 25 | 4.64 | 27 | 2.64 | |||
| Average population | 500 | Average population | 500 | |||
| Month | Cases (%), 1907 | Cases (%), 1912 |
| January | 13.75 | 1.98 |
| February | 16.44 | 1.63 |
| March | 11.95 | 1.78 |
| April | 6.79 | .81 |
| May | 5.28 | .53 |
| June | 9.49 | 1.80 |
| July | 12.23 | 1.99 |
| Aug. | 14.03 | 1.76 |
| September | 8.09 | .93 |
| October | 4.35 | .73 |
| November | 3.45 | .87 |
| December | 3.22 | .76 |
| Average population | 3,000 | 6,100 |